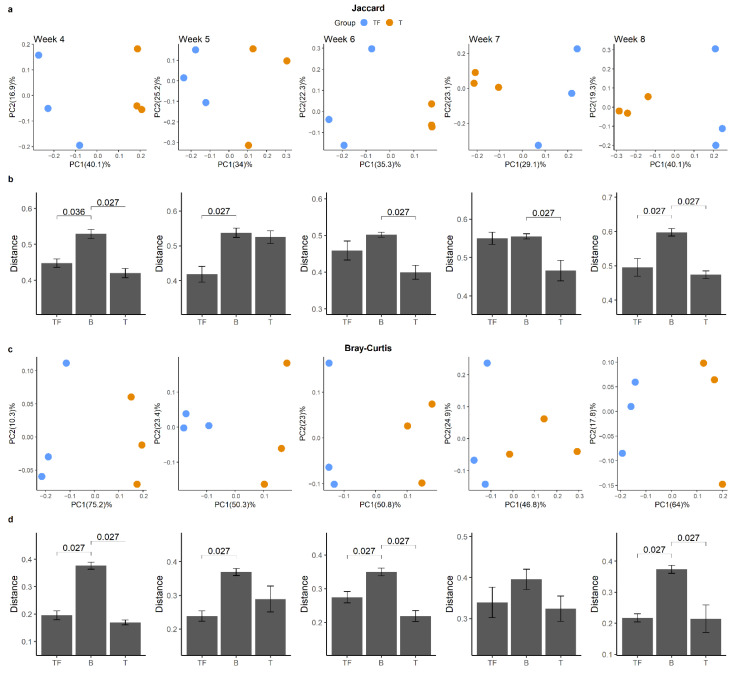
Figure 5.
Beta diversity analysis for gut microbiota from two groups at different time points. PCoA plots derived from (a) Jaccard distance and (c) Bray–Curtis distance for the five time points show the separation between T and TF groups. The distribution of Jaccard (b) and Bray–Curtis (d) beta-diversity distances within and between T and TF groups reveals the difference between T and TF at different time points. The distances within TF and T groups are noted as TF and T, respectively, while the distance between TF and T groups is noted as B. p values derived from Wilcoxon rank-sum test are shown in the bar plots.

