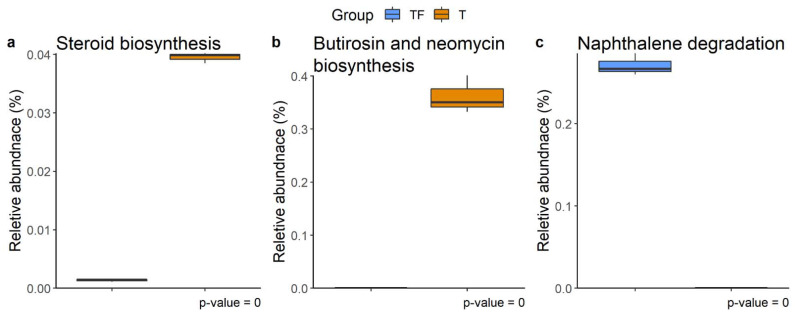
Figure 8.
Different abundant KEGG metabolic pathways. (a) Steroid biosynthesis, (b) butirosin and neomycin biosynthesis, and (c) naphthalene degradation were found at week 4, week 7, and week 8, respectively. The relative abundance of function predicted by PICRUSt2 showed the different abundance of taxa predicted to have a specific function in T and TF groups. The BH adjusted p values from White’s non-parametric t-test are shown at the bottom of the box plots.

