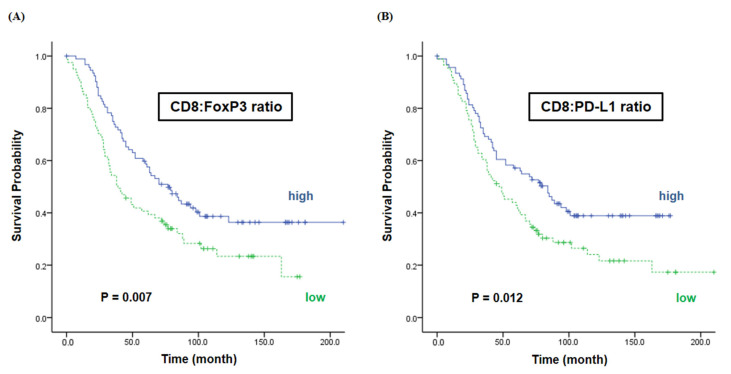
Figure 4.
Overall survival according to the ratios of CD8 vs. FoxP3/PD-L1. We classified patients according to the ratio of marker expression, CD8 to FoxP3 and CD8 to PD-L1, and analyzed overall survival according to their ratio. As a result, these two expression ratios of immune markers were significantly associated with survival rate. (A) The median OS was 77 months in the high CD8 to FoxP3 ratio group and 39 months in the low CD8 to FoxP3 ratio group (p = 0.007). (B) The median OS was 84 months in the high CD8 to PD-L1 ratio group and 47 months in the low CD8 to PD-L1 ratio group (p = 0.012).

