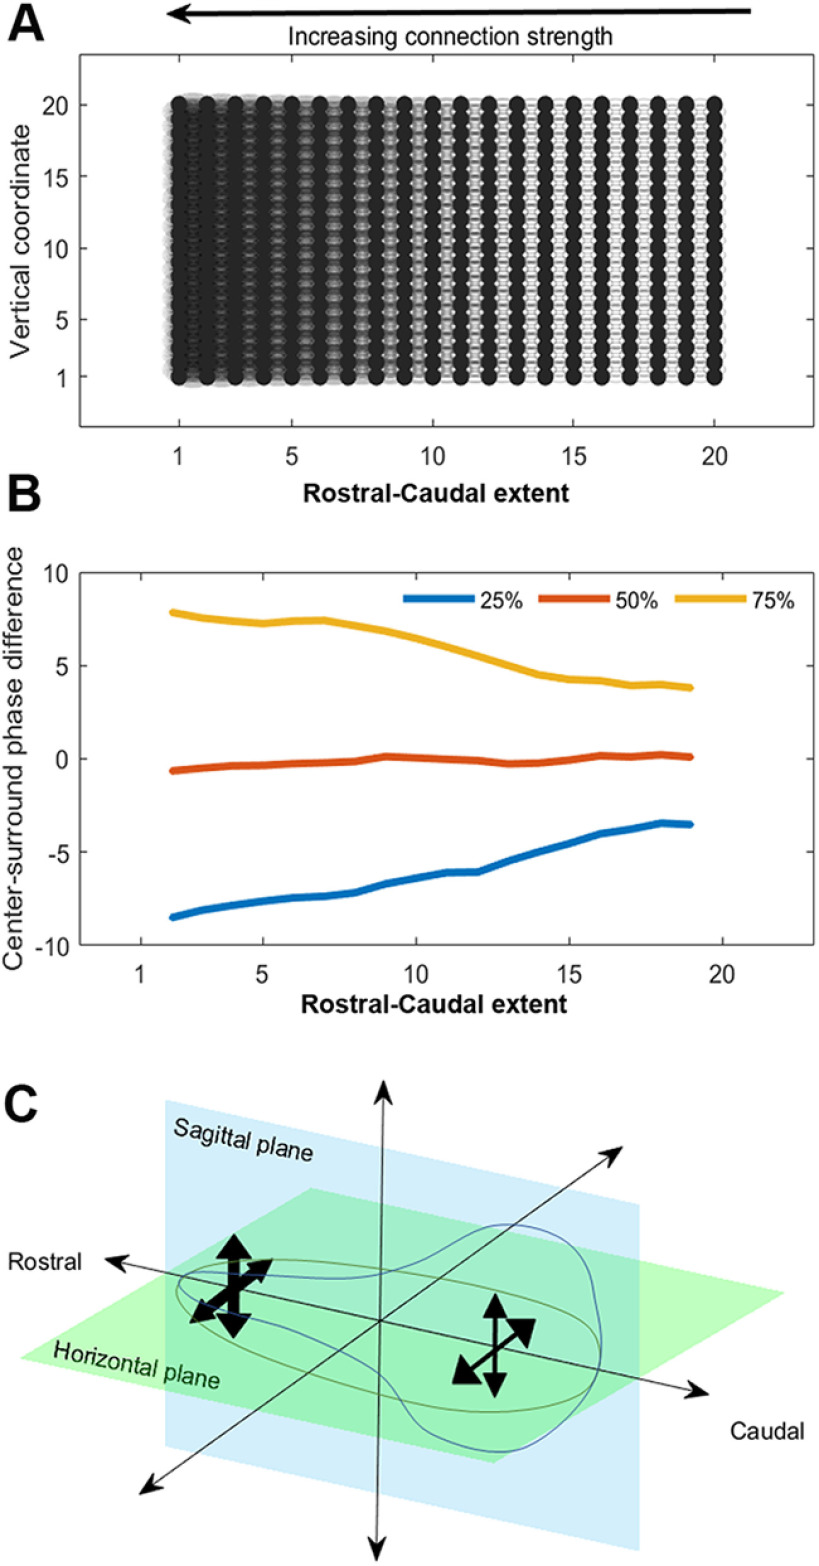
Figure 4.
Kuramoto models connect the magnitude of local phase differences with the strength of local connectivity. A, A schematic of the network connectivity we use in simulations using the Kuramoto coupled oscillator model. The differences in shading from right to left indicate quadratically growing strength of the nearest neighbor coupling in the model. B, Results of applying the center-surround filter to simulated data over 500 trials. We report the quartiles of the distribution of local phase differences for each column of oscillators (as in A) as we move from right to left, showing that as the connectivity grows, so does the magnitude of the local phase differences. C, A schematic summarizing the interpretation of the local phase differences in the context of simulation results. Comparing to simulation results provides evidence that connection strength is weaker at the caudal edge of sagittal and horizontal sections and grows as we move toward the rostral tip.

