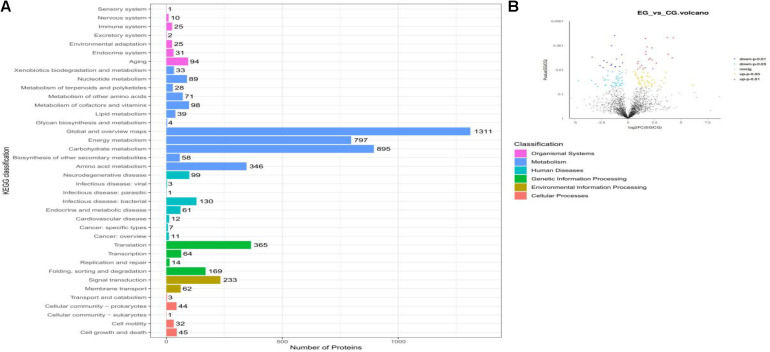
FIGURE 3.
Metaproteomics analyses of proteins in the rumen fluid microbiota of beef cattle fed a CrPyr supplementation diet. (A) KEGG classification. (B) Volcano plots of differentially expressed proteins between EG and CG. EG, experimental group, diet supplemented with 60 g/day CrPyr; CG, control group. Each dot represents the mean expression level (n = 3) of a single protein. The yellow dots indicate the significantly up-regulated proteins at the P < 0.05 level, the red dots indicate the significantly up-regulated proteins at the P < 0.01 level, the light blue dot indicates the significantly down-regulated proteins at the P < 0.05 level, and the blue dot indicates the significantly down-regulated proteins at the P < 0.01 level.

