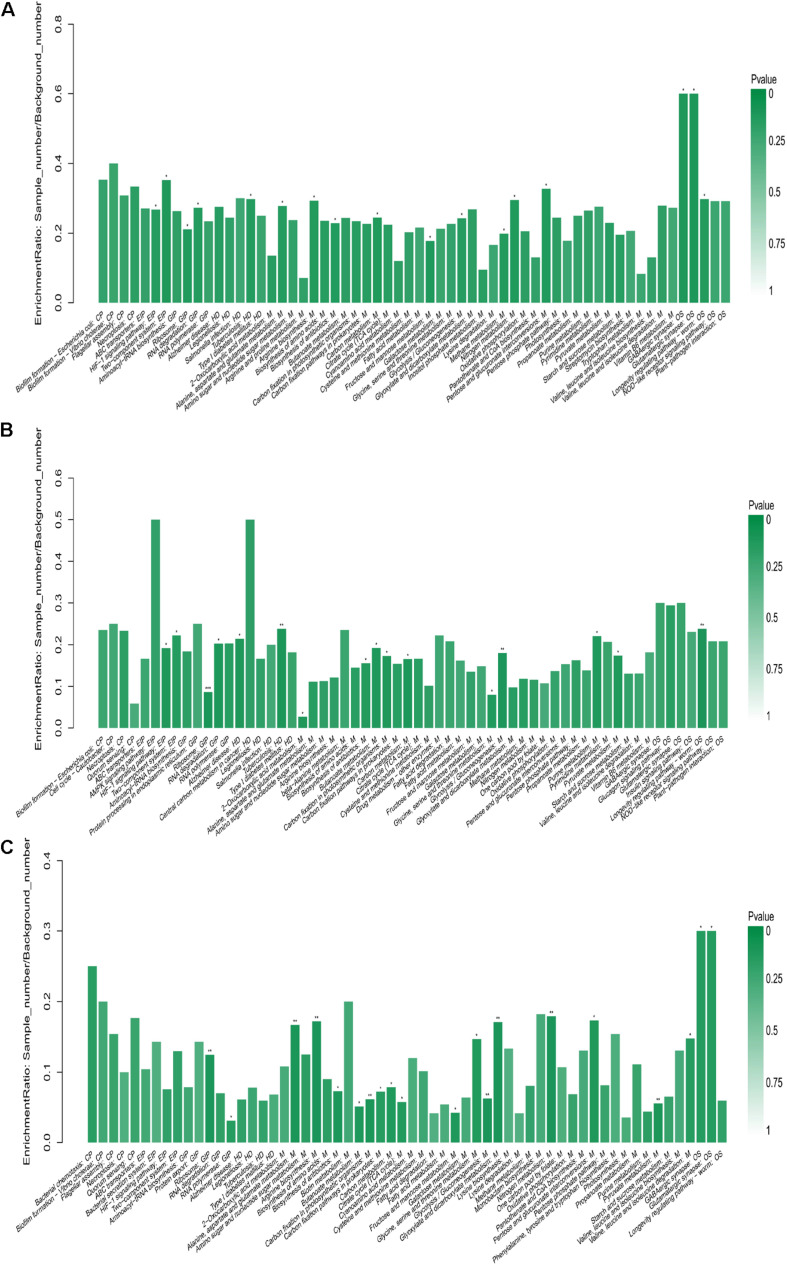
FIGURE 5.
KEGG enrichment of differentially expressed proteins. (A) KEGG enrichment analysis of all differentially expressed proteins. (B) KEGG enrichment analysis of all up-regulated differentially expressed proteins (experimental group vs. control group, EG vs. CG). (C) KEGG enrichment analysis of all down-regulated differentially expressed proteins (experimental group vs. control group, EG vs. CG). CP, cellular processes; EIP, environmental information processing; GIP, genetic information processing; HD, human diseases; M, metabolism; and OS, organismal systems.

