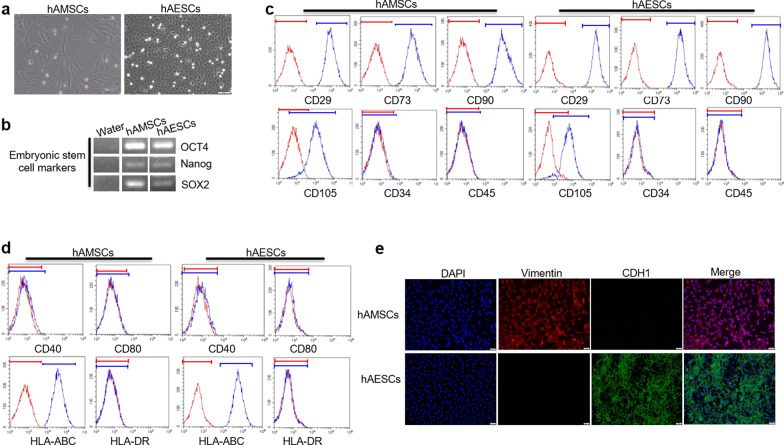
Fig. 1.
Identification of hAMSCs and hAESCs. a Representative photomicrograph of adherent hAMSCs and hAESCs. Scale bar = 50 μm. b The expressions of markers including Nanog, SOX2 and OCT4 in hAMSCs or hAESCs were analyzed by RT-PCR and water was used as negative control. c The expressions of markers including CD29, CD90, CD73, CD105, CD34, CD45 were analyzed by flow cytometry in hAMSCs or hAESCs. The red lines represent the isotype control, and the blue lines represent the surface markers. d The expressions of markers including HLA-DR, CD80, CD40 and HLA-ABC were analyzed by flow cytometry in hAMSCs or hAESCs. e The expressions of vimentin and CDH1 were detected by immunofluorescence staining in hAMSCs and hAESCs. Scale bar = 20 μm. Data are presented as mean ± SD. The experiments were repeated three times independently and the data of one representative experiment was shown

