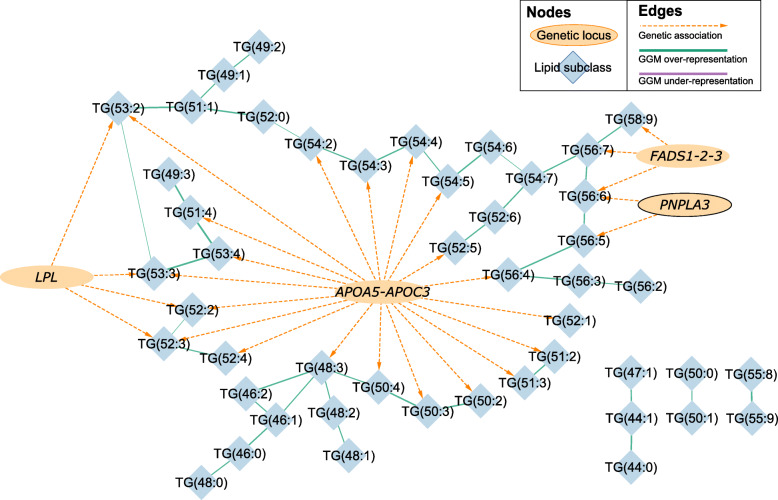
Fig. 4.
Combined network graph summarising genetic associations and a Gaussian graphical model (GGM) relating to levels of individual triglycerides in PROMIS. Nodes representing genetic loci are each labelled with the most likely “causal” gene at that locus according to our functional annotation (see “Methods” section). In order for an edge to be drawn between a genetic locus and a triglyceride, there must have been a minimum of one variant at that locus significantly (P < 8.9 x 10⁻¹⁰) associated with at least one triglyceride. Edges between triglycerides indicate whether there was either a significant over- (green) or under- (purple) representation, with the magnitude indicated by the thickness of the edges

