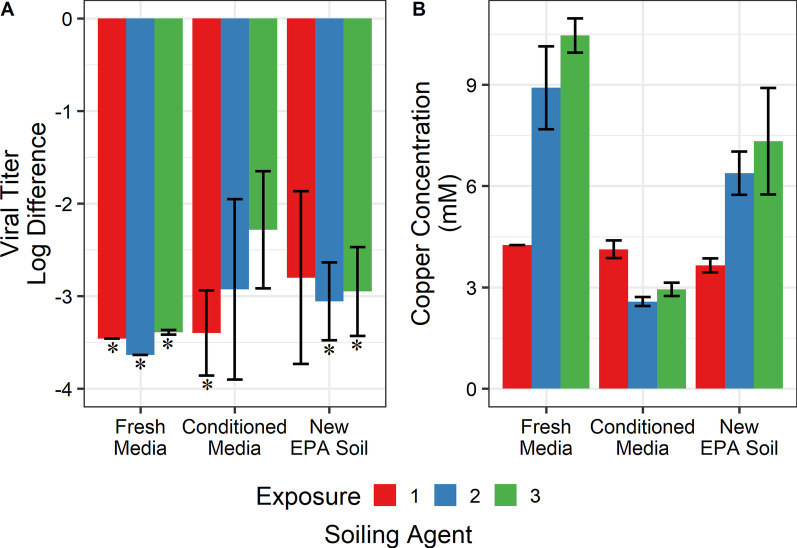
Fig. 6.
A As in Fig. 5B, virus suspended in three different matrices was dried onto the copper alloy. The alloy was exposed to each virus suspension a total of three times. Each bar is the geometric mean of two technical replicates and two biological replicates (n = 4). Error bars represent the standard deviation. Asterisks indicate at least one replicate was at or below the detection limit. B ICP-OES of samples collected in A. Only the copper ion concentrations are presented here for clarity. Error bars represent the standard deviation. Each colour corresponds to the exposure

