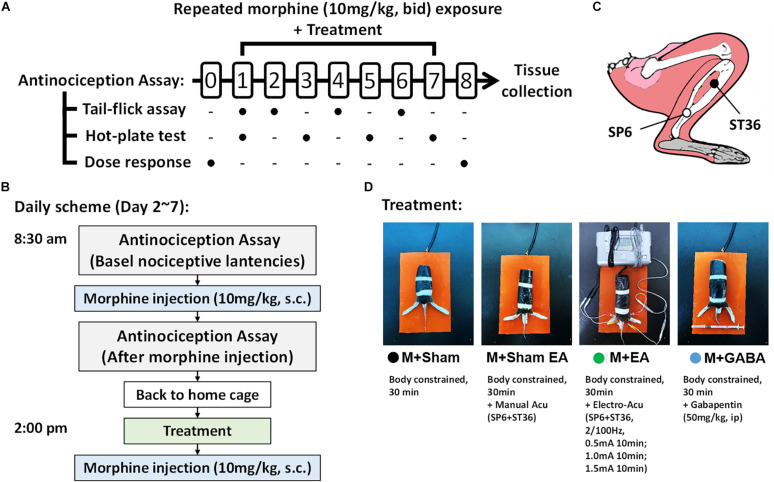
FIGURE 1.
Experimental method and flow chart. (A) Schematic illustrating the experimental design of the analgesia tolerance paradigm. Animals were acclimated to the testing environment and investigators for at least 2 weeks. Dose–response curves were determined using a cumulative dosing scheme on day 0 and day 8. The baseline latencies of both two assays were performed at day 1. From the 1st day to the 7th day, the tail-flick test and hot-plate test will be conducted alternately to compare the effects of different treatments on the development of morphine tolerance. (B) The Treatment and drug administration were performed as described above in the section “Materials and Methods”. (C) Schematic diagram of mouse acupuncture points of SP6 and ST36. (D) Different treatments between groups during the 2nd day to the 7th day.

