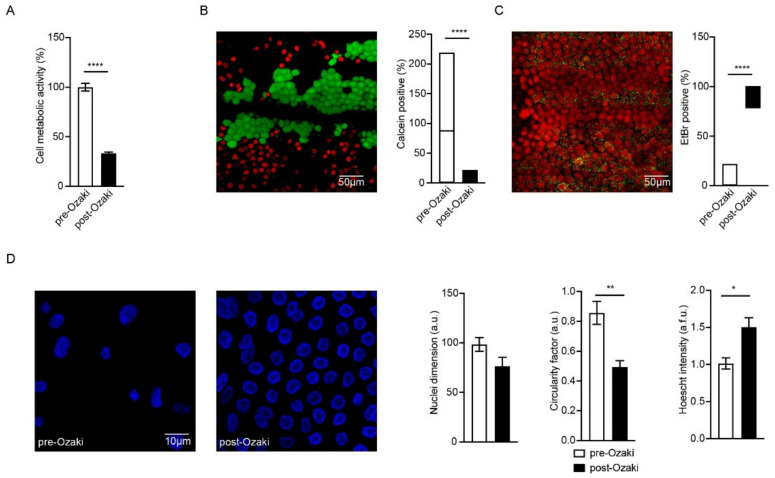
Figure 3.
Evaluation of cell viability in peri cardial samples after treatment with GA (post-Ozaki) in comparison to native pericardium (pre-Ozaki). (A) MTT assay shows that residual cell viability in post-Ozaki samples is 33.32 ± 1.29% when compared to that of pre-Ozaki samples. **** p < 0.0001; n = 15. (B,C) Representative images of pre-Ozaki and post-Ozaki samples, respectively, showing live (green) and dead (red) cells, and their quantification (graphs in panel (B) and panel (C), respectively). **** p < 0.0001; n = 15. (D) Representative images of nuclear morphology following Hoechst staining (blue) and evaluation of nuclei dimension (left graph), circularity factor (center graph), and Hoechst intensity (right graph). * p < 0.05, ** p < 0.01; n = 15.

