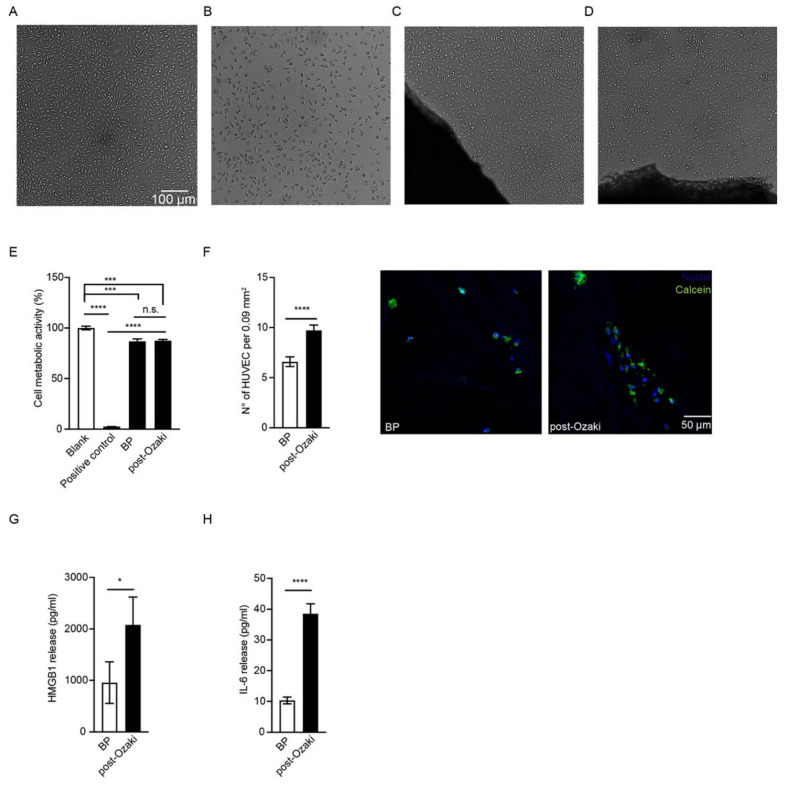
Figure 4.
Citotoxicity assay, endothelialization, and expression of pro-inflammatory mediators in the post-Ozaki pericardium and BP control membranes. Morphology of L929 mouse fibroblasts cultured (A) without tested materials (blank), (B) in the presence of 0.6% GA (positive control), or grown in contact with (C) the commercial BP membrane (negative control) and (D) post-Ozaki samples. (E) Quantification of cytotoxicity by the MTT assay. Data are expressed as a percentage of viability referred to control cells growing without tested materials. *** p < 0.001, **** p < 0.0001; n = 15. (F) Quantification of endothelial cell number on the fibrous side of pericardium 4 days after seeding. **** p < 0.0001; n = 15. Representative images of HUVEC, labelled with the vital dye calcein-AM (in green) and the nuclear dye Hoechst (in blue), adhering on the BP membrane (left) and on post-Ozaki pericardium (right). Quantification of (G) HMGB1 and (H) IL-6 from cell culture supernatant after 4 days from seeding. * p < 0.05, **** p < 0.0001; n = 15.

