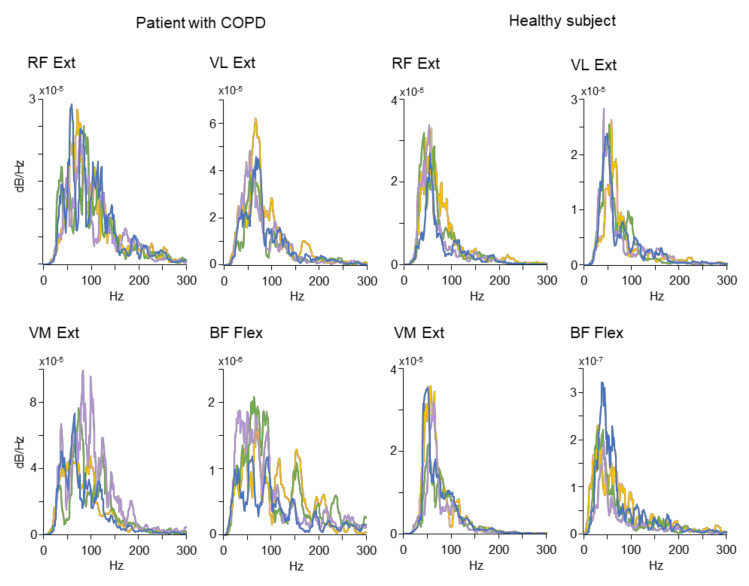
Figure 3.
Representative examples of Power Spectrum Density of sEMG recorded in a patient with COPD (the four panels on the left) and in a healthy subject (the four panels on the right). Each panel contains four spectral profiles obtained from the second (blue line), the fourth (purple line), the sixth (green line) and the eighth (yellow line) leg extension (Ext) or flexion (Flex) movements. Power spectra regarding the RF, VL and VM were obtained during the extension movements, while the spectrum regarding the BF was obtained during flexion movements. For other abbreviations see Figure 2.

