FIGURE 2.

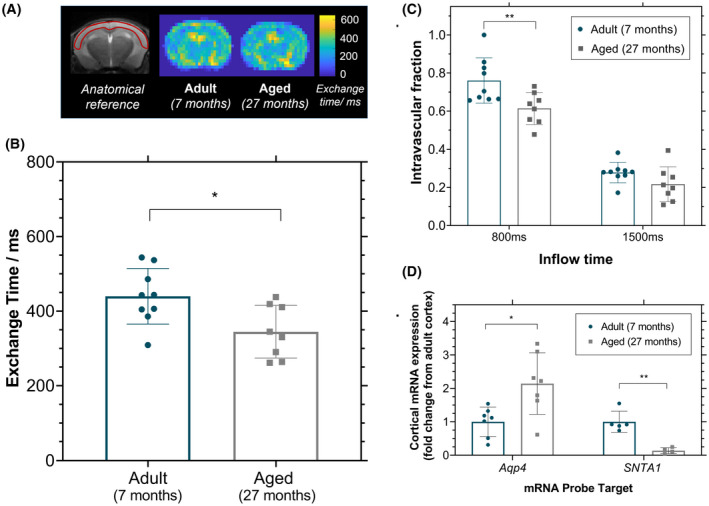
Cortical blood–brain barrier permeability to water. A, Mean exchange time maps for adult and aged mice, with an anatomical reference image on the left with the cortical region of interest in red. B, Cortical exchange time measurements as index for blood–brain barrier water permeability for individual animals. C, The intravascular fraction (ΔM IV/ΔM IV + ΔM EV) determined for the individual animals at both inflow times. D, Cortical mRNA expression in aging of aquaporin‐4 (Aqp4), α‐syntrophin protein (SNTA1) reported as fold‐change from the adult cortex. All plots indicate the mean value and associated error (± standard deviation) for adult mice (n = 9) and aged mice (n = 8). *P < .05; **P < .01
