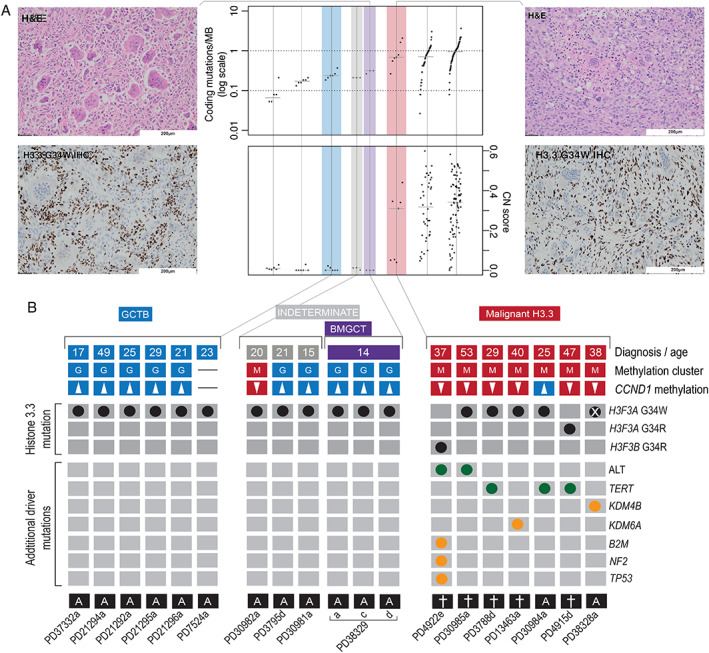
Figure 1.

Landscape of H3.3‐mutant tumours. (A) Photomicrographs of H&E and H3.3 G34W immunostained tissue sections of a benign metastasising (far left) and malignant giant cell tumour of bone (far right). Both tumours are osteoclast‐rich but the malignant neoplasm exhibits cellular atypia. Mutational burden of samples in comparison with selected other mesenchymal tumours (centre panel): osteoblastoma [20], chondroblastoma [5], chondrosarcoma [21] (*exome data only; SVs not shown), and osteosarcoma [10]. (B) The genomic and methylation classification of sequenced tumours. From top to bottom: clinical diagnoses and age, unsupervised methylation cluster assignment, CCND1 promoter methylation status (hypermethylation defined as a mean CCND1 promoter methylation beta value greater than the fifth centile for GCT), and a tileplot of curated drivers; clinical outcomes are shown underneath (more detailed clinical outcomes are shown in supplementary material, Table S1). Note sample PD38328a had undergone deletion of the H3‐3A locus, which had been present on the pre‐resection biopsy (supplementary material, Figure S11). Sample PD37332a was a biphasic tumour with one component showing classical features of a benign GCTB merging with a low‐grade osteosarcomatous component; so, although classified as benign (and the methylation array was from the benign component), the tumour overall would be considered a malignant GCTB.
