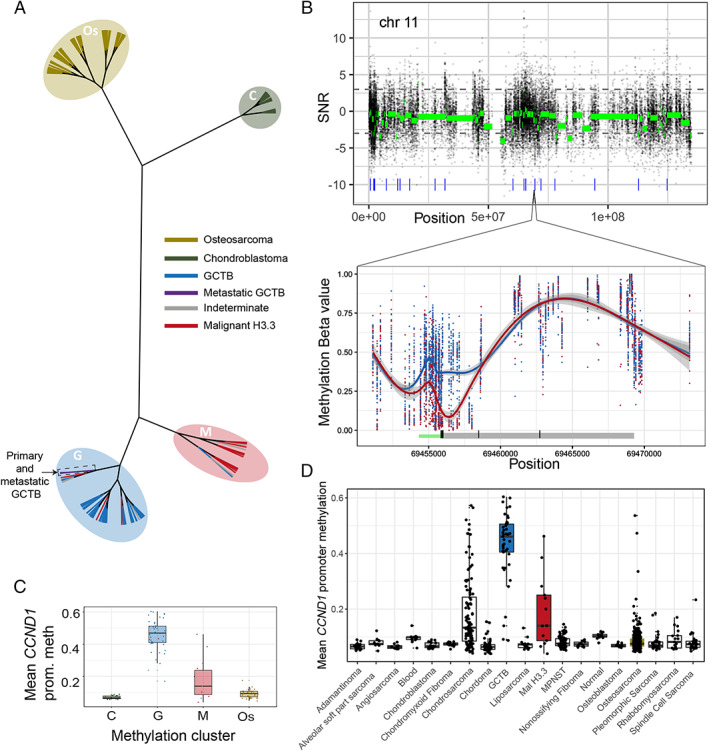
Figure 2.

Methylation changes of H3.3‐mutant tumours. (A) Hierarchical (unrooted) clustering of tumours. Leaves are coloured by diagnosis and the methylation clusters annotated with shaded ovals. (B) Analysis of methylation differences between malignant (‘M’) and benign (‘G’) tumours (n = 13 and 42, respectively) across chromosome 11 (upper) and across CCND1 (lower). Raw (black) and segmented (green) signal–noise ratios (SNR; >0 shows greater methylation in malignant tumours) are plotted. Blue ticks in the upper plot represent DMRs. In the lower plot, raw methylation beta values across CCND1 are shown for each sample. The underlying schematic represents the CCND1 gene body (grey) and the predicted promoter (green). (C) Mean CCND1 promoter methylation across the clustered samples from A and (D) a variety of other tissues.
