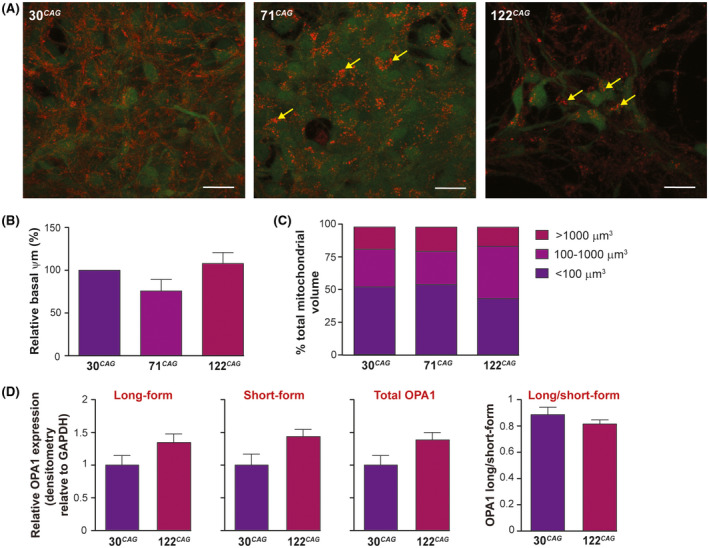
FIGURE 7.

Mitochondrial morphology in ReNcell VM 122 CAG neurons. A, Maximum intensity projection images of z‐stacks taken during live imaging of exon 1 HTT neurons following pre‐incubation with TMRM (red). GFP expression is also visualized (green). Mitochondria appear aggregated and dysmorphic in 122 CAG cells, compared with the reticular appearance of mitochondria in 30 CAG cells (yellow arrows). Scale bar = 20 µm. B, There is a trend towards a reduced basal Ψm in 71 CAG cells as measured by confocal live imaging with TMRM but not in the 122 CAG line. Mean intensities per unit volume were calculated from 3 to 4 non‐overlapping FOVs from three independent cultures per line, and calculated as a percentage of control (30 CAG). Data are shown as mean ± SEM. C, Individual mitochondria detected within cells were classified as small (<100 µm3), medium (100‐1000 µm3), or large (>1000 µm3), and the sum of all mitochondrial volumes within each category expressed as a percentage of total mitochondrial volume. There is an apparent reduction in the proportion of small mitochondria and increase in proportion of medium‐sized mitochondrial puncta in 122 CAG neurons. D, Quantification of OPA1 isoforms by band densitometry of the Western blot from 30 CAG and 122 CAG DD14 samples showed no significant difference in expression of long‐form, short‐form, or total OPA1 normalized to GAPDH, or the ratio of long and short forms. Data are shown as mean ± SEM
