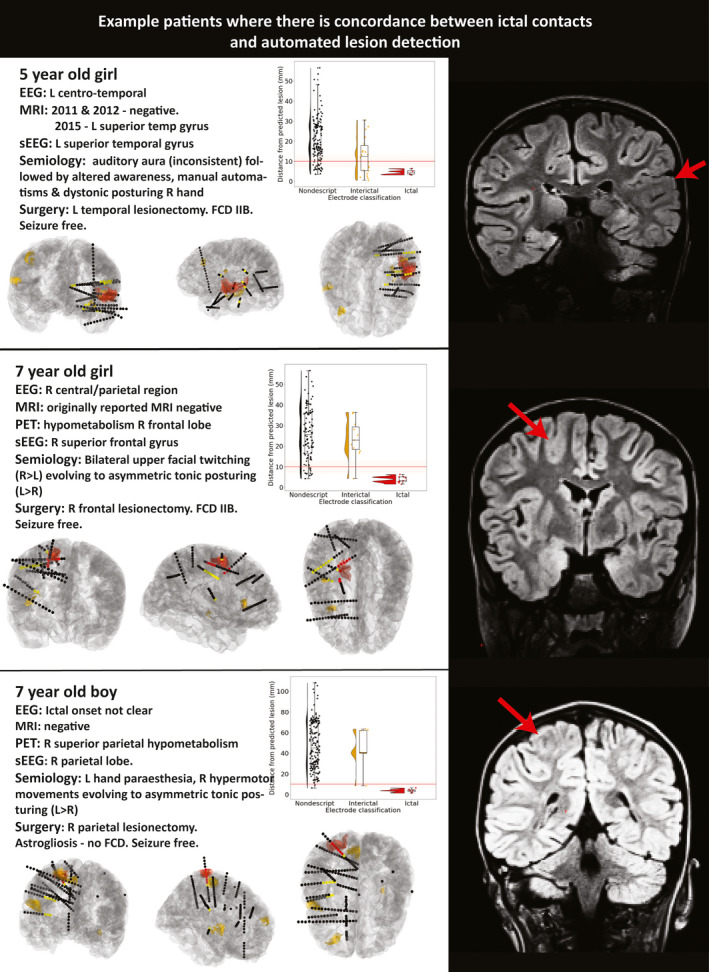
FIGURE 3.

Case studies of three sample patients where there is colocalization between ictal contacts and automated lesion detection. Ictal contacts (red contacts) are within 10 mm of the automated classifier prediction (red cluster). For each patient, a brief clinical overview (left upper), a plot of distance of the stereoelectroencephalography (sEEG) contacts from the predicted lesion (right upper), visualization of the electrode positioning (ictal contacts = red, interictal = yellow, other = black) with automated clusters (red = top cluster, yellow = other clusters, lower panels), and a coronal section of fluid‐attenuated inversion recovery magnetic resonance imaging (MRI) with lesion indicated by red arrow are shown. L, left; R, right; FCD, focal cortical dysplasia; PET, positron emission tomography
