FIGURE 3.

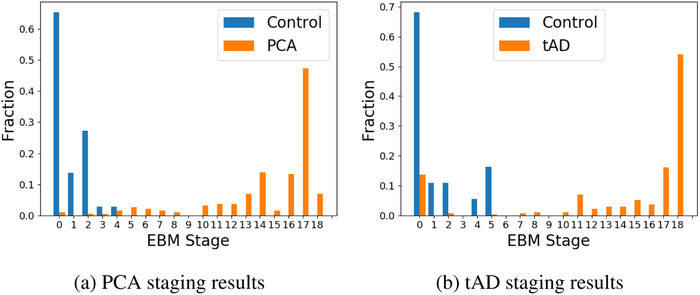
Histogram of model stages assigned to healthy controls and patients with posterior cortical atrophy (PCA) and typical Alzheimer's disease (tAD)

Histogram of model stages assigned to healthy controls and patients with posterior cortical atrophy (PCA) and typical Alzheimer's disease (tAD)