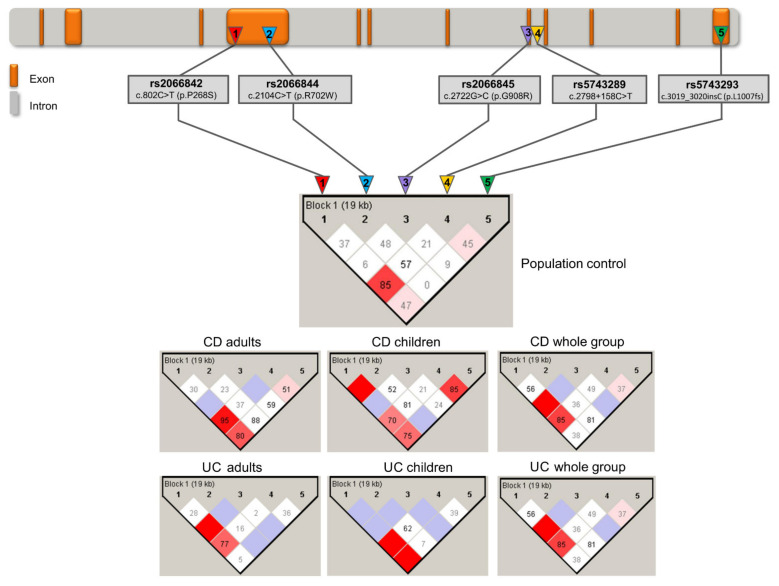
Figure 1.
Haplotype analysis of the NOD2 gene in IBD patients and controls. The top of the figure shows the NOD2 gene scheme. Analyzed polymorphisms are marked. Tested SNPs were assigned with a number (1–5), which corresponds to the haplotype diagrams presented at the bottom of the figure. Haplotype diagrams concerning all tested groups were prepared with Haploview v.4.2, and show linkage disequilibrium values among SNPs located in the NOD2 gene. The absolute value of Lewontin’s measure of linkage disequilibrium, D′, was calculated and graphically displayed for all pairs of markers. Numbers in squares represent the D′ statistic × 100 for each pairwise comparison linked by the box if D′ = 1 boxes do not have a shown value. The intensity of the filled-in boxes corresponds with the degree of linkage disequilibrium.

