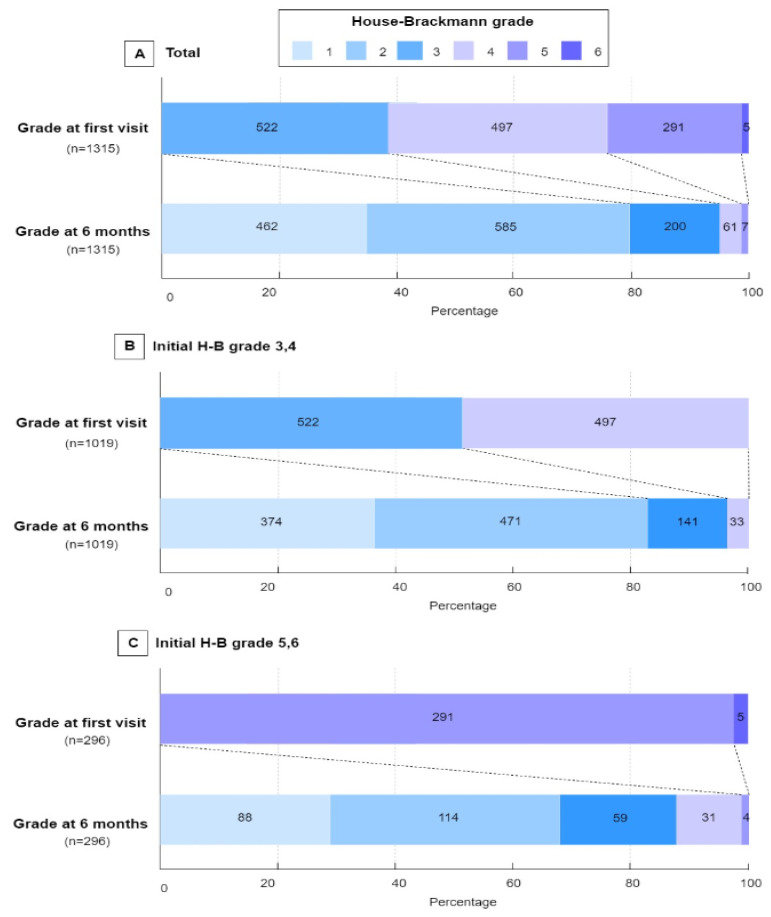
Figure 2.
Distribution of the House–Brackmann grade at initially and at 6 months. The House–Brackmann (H-B) grade ranges from 1 (indicating normal) to 6 (total paralysis). Each cell corresponds with an H-B grade; the width of the cell represents the proportion of patients with equivalent grades and the number of patients is displayed within the cell.

