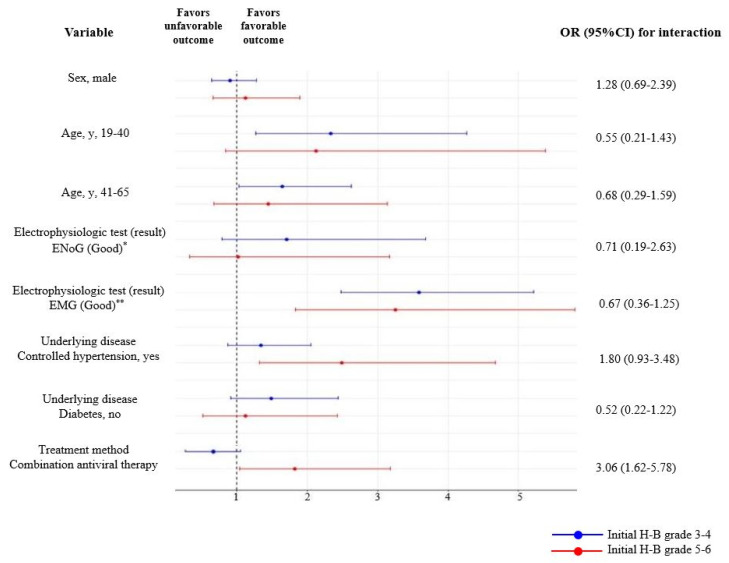
Figure 3.
Results of subgroup analysis of secondary outcomes according to the initial H-B grade. The blue lines represent groups with initial House–Brackmann (H-B) grades 3–4, and the red lines represent groups with initial H-B grades 5–6. * Good results were defined as <90% degeneration on the affected side of the facial nerve, ** Good results were defined as the absence of pathologic spontaneous fibrillation activity. 95% CI = 95% confidence interval, H-B grade = House–Brackmann grade, ENoG = electroneuronography, EMG = electromyography.

