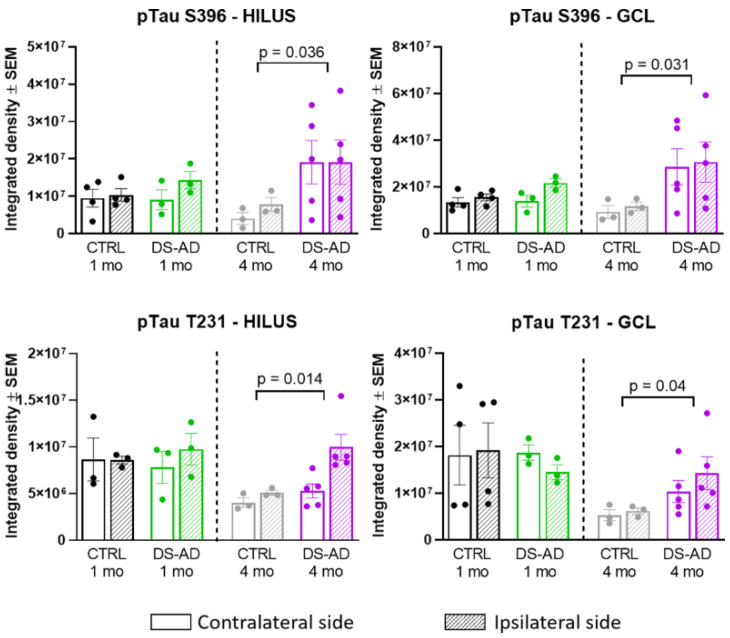
Figure 6.
Densitometry of p-Tau S396, and p-Tau T231 in the Hilar region (left panels) and the GCL (right panels) of the hippocampus. There was a significant increase in p-Tau S396 staining in the Hilar region between DS-AD and controls at 4 months (p = 0.03) and in the GCL (p = 0.03). In addition, there was a significant increase in T231 p-Tau after 4 months in mice injected with DS-AD vs. Controls in the hilar region (p = 0.014) and in the GCL (p = 0.04).

