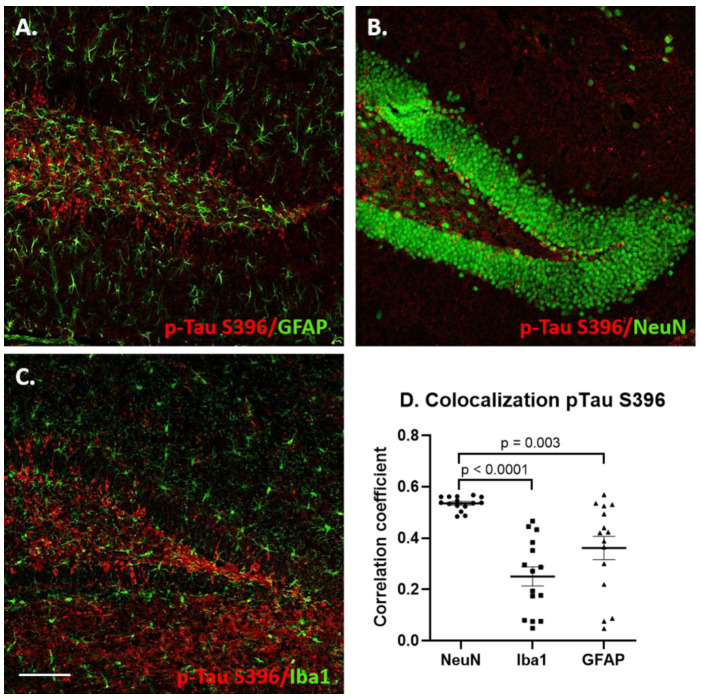
Figure 9.
Co-localization of p-Tau S396 staining with neuronal and glial markers in the dentate gyrus region of hippocampus 1 month following DS-AD NDEV injections. (A) Double labeling for p-Tau S396 (red) and GFAP (green), (B) double labeling for p-Tau S396 (red) and NeuN (green), (C) double labeling for p-Tau S396 (red) and Iba1 (green). Scale bar in C corresponds to 100 microns. The scatter plot graph (D) shows the correlation coefficients for p-Tau S396 with NeuN, Iba1 and GFAP.

