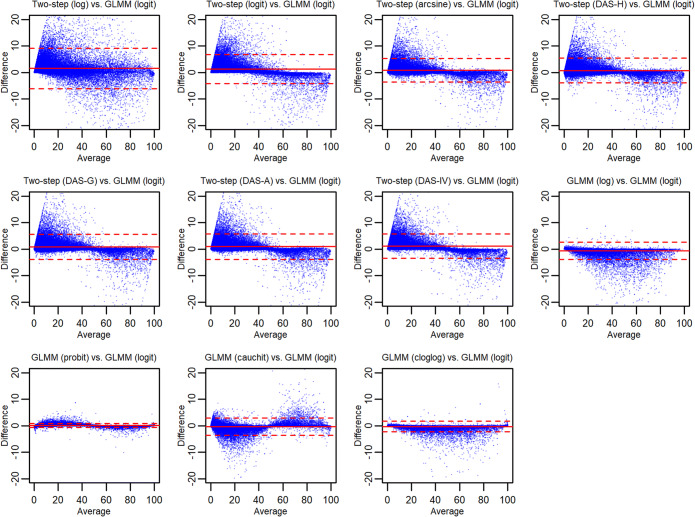
Figure 3.
Bland–Altman plots of agreement between overall proportion estimates (in percentage) produced by various meta-analysis methods and those by the generalized linear mixed model with the logit link among Cochrane datasets. In each panel, the horizontal solid line represents the mean difference, and the horizontal dashed lines represent 95% limits of agreement. The two-step method (DAS-H, DAS-G, DAS-A, or DAS-IV) corresponds to the Freeman–Tukey double-arcsine (DAS) transformation, using the harmonic (H), geometric (G), or arithmetic (A) mean of study-specific sample sizes, or using the inverse of the variance (IV) of the synthesized result, as the overall sample size.

