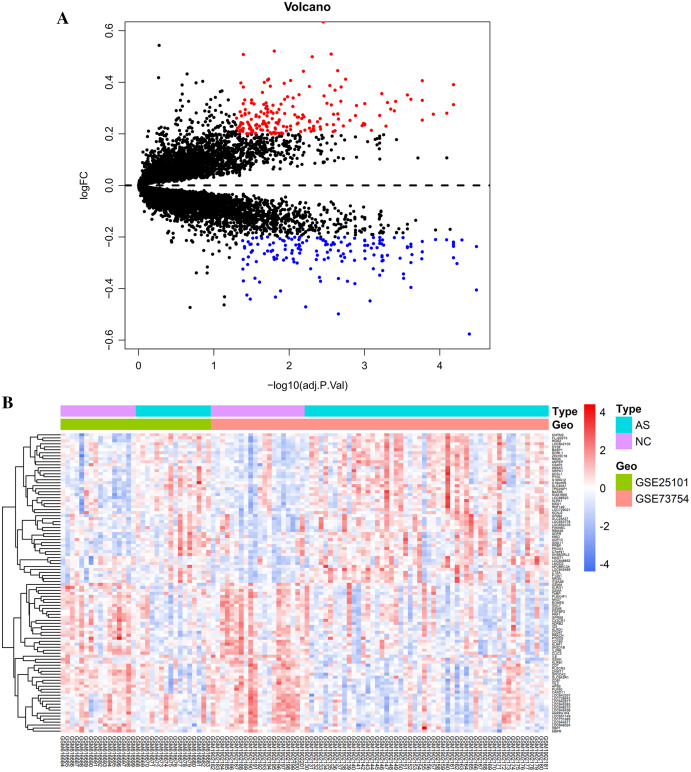
Figure 1. Visualization of differentially expressed genes (DEGs).
(A) DEGs screened by threshold (adjusted P value < 0.05 and |logFC| > 0.2) were presented by volcano plot. (B) Heatmap showed the expression of top 50 upregulated and downregulated genes ordered by adjusted P-value. Red indicated that the expression of genes was relatively upregulated, and the blue indicated the expression of genes was relatively downregulated.

