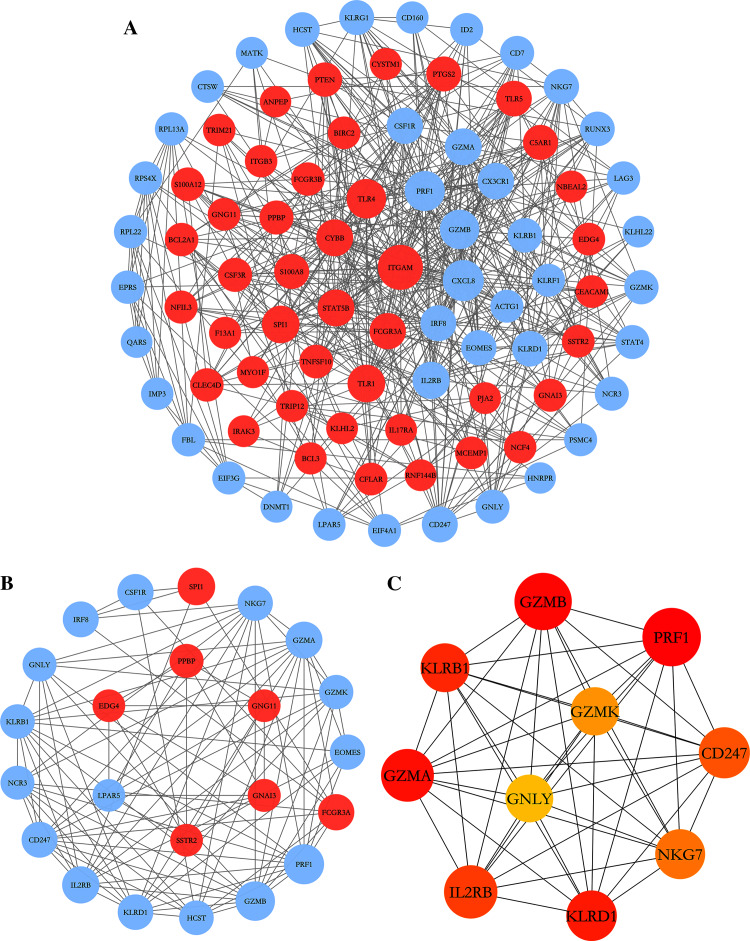
Figure 4. PPI network construction and module analysis.
(A) The PPI network of DEGs was constructed in Cytoscape, Nodes represent proteins and edges represent interactions between two proteins. (B) The most significant module was obtained by MCODE plug-in. Red nodes represent upregulated DEGs and blue nodes represent downregulated DEGs. The diameters of nodes were positively correlated with their connectivity degree. (C) Hub genes selected by calculating the MCC scores of cytoHubba plugin.

