
Figure 6. Hh signal is required for proliferative and osteogenic effects of teriparatide.
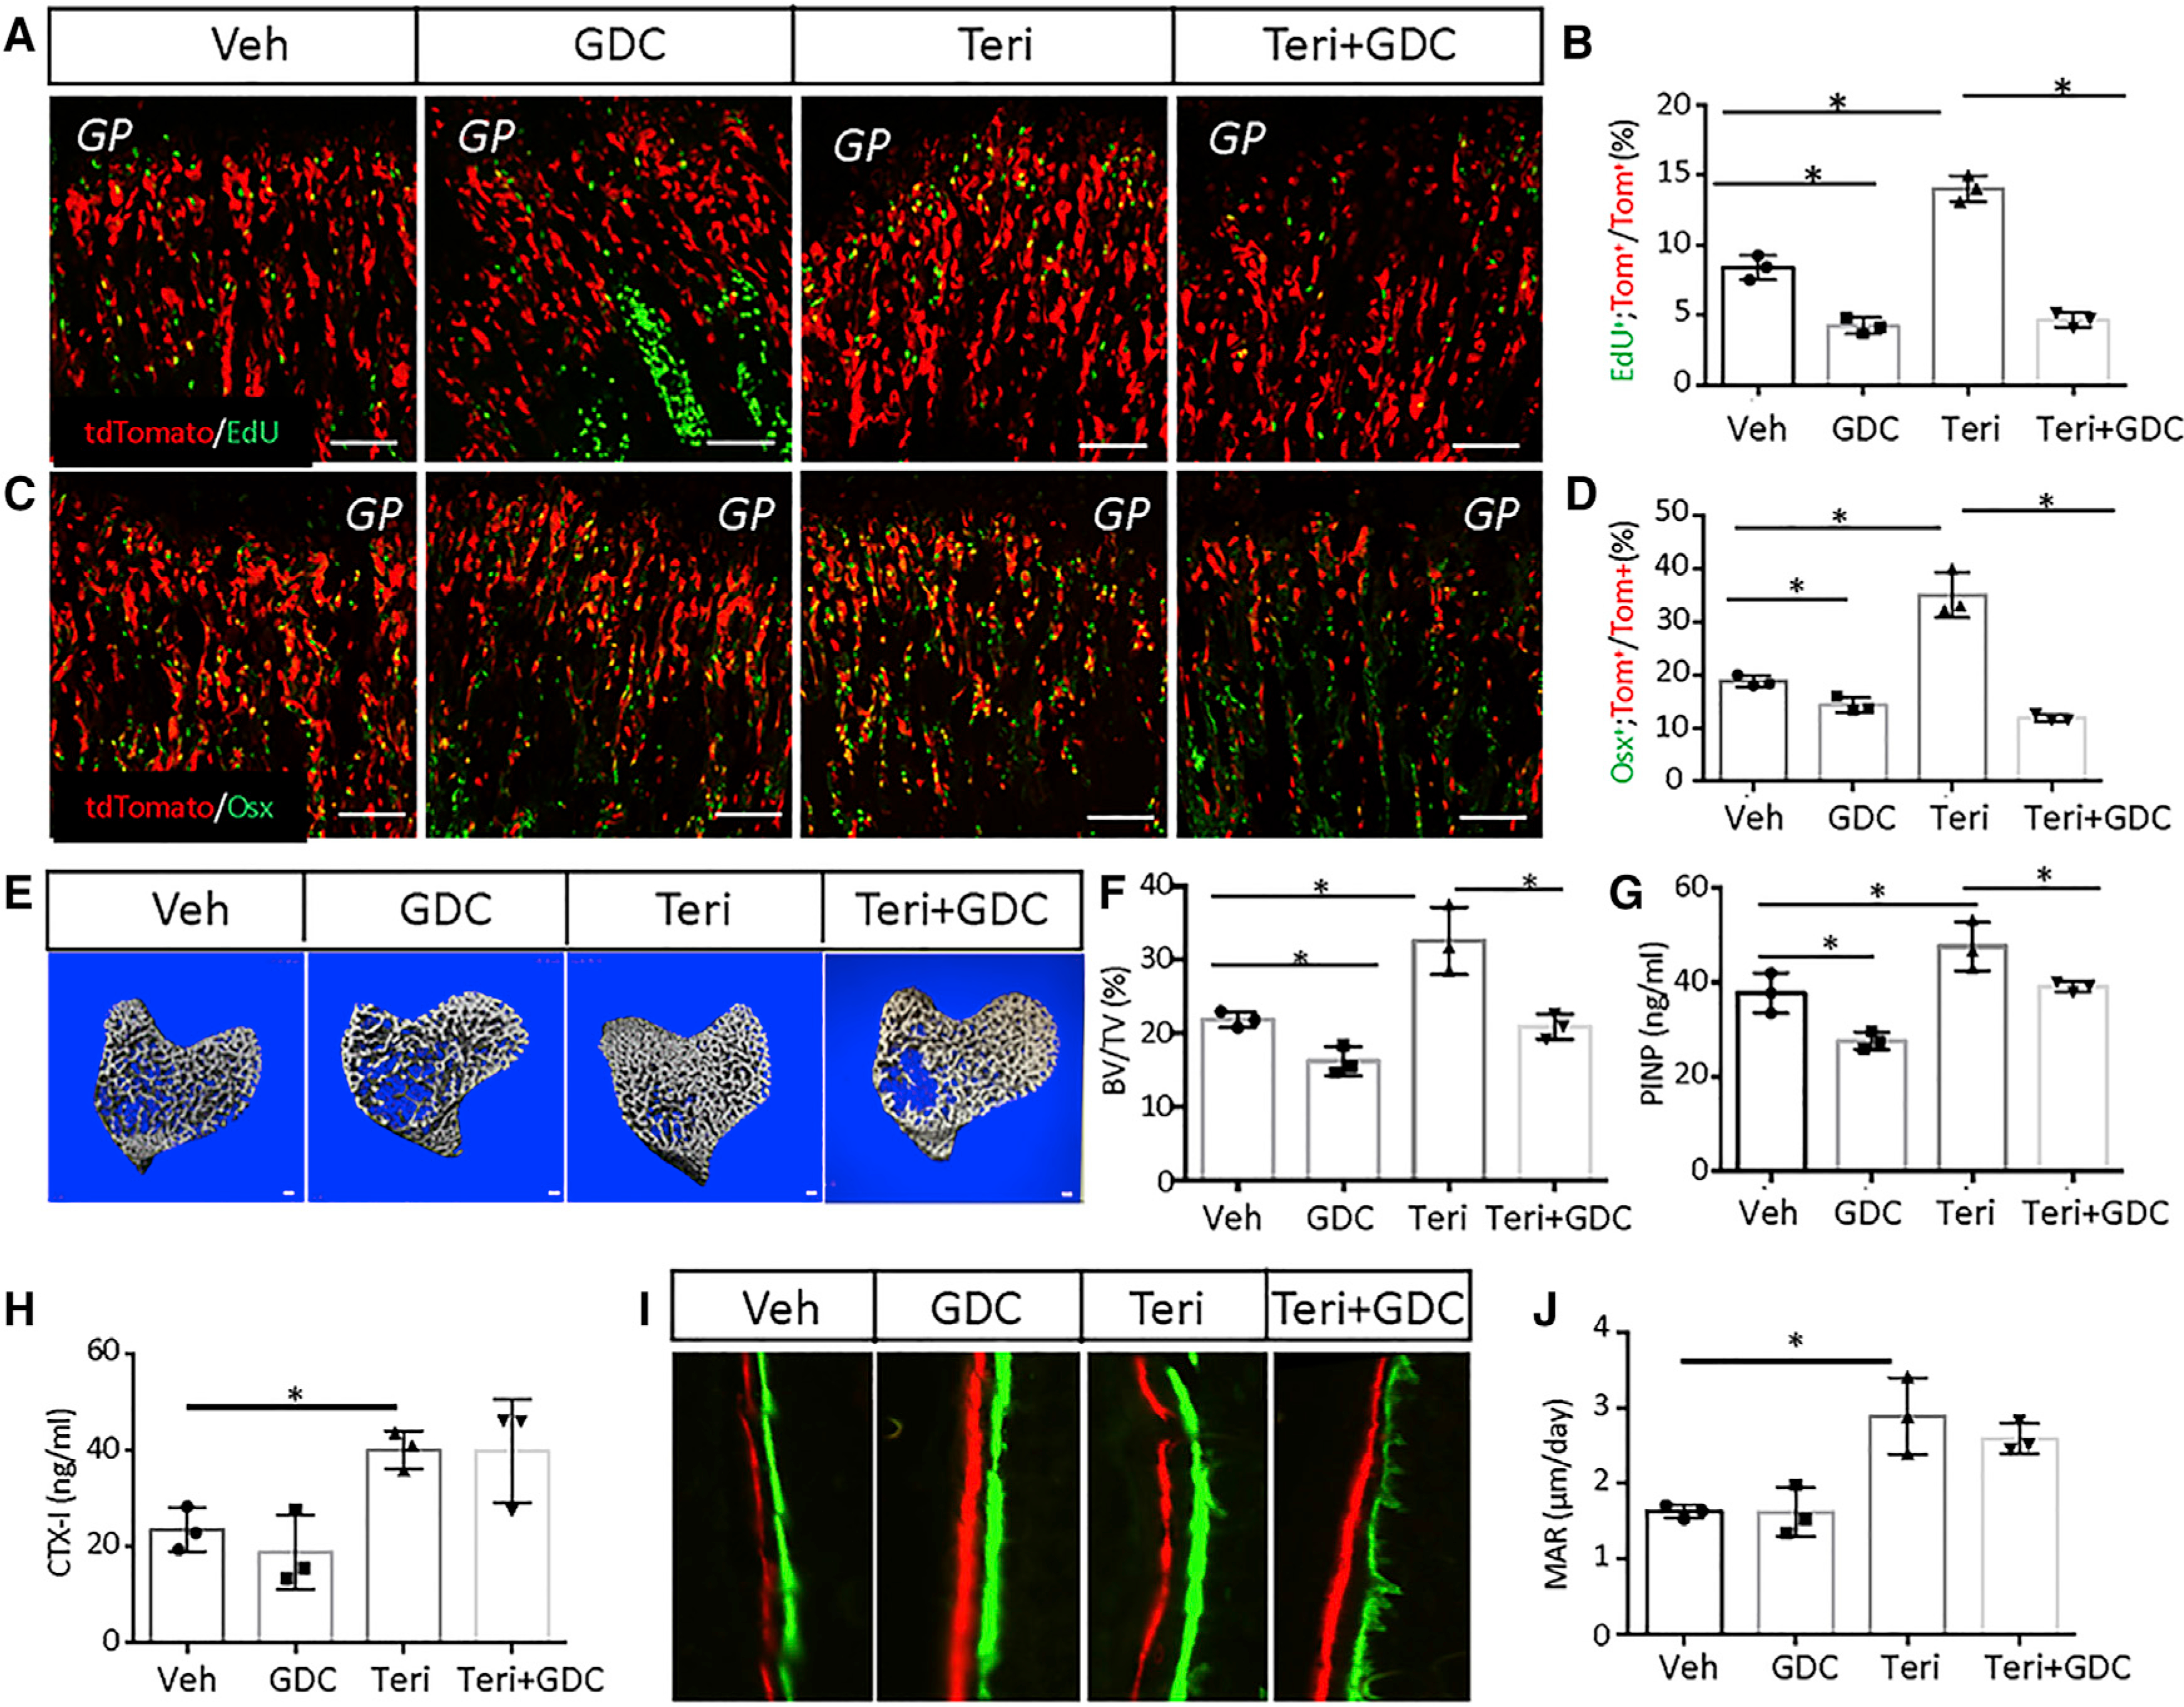
(A and C) Representative confocal images of the chondro-osseous junction in the distal femur. Gli1-CreERT2;Ai9 mice were first treated with TAM and then injected with GDC, teriparatide, or both for 3 days. Scale bar: 100 μm. PBS was used as vehicle control.
(B and D) Quantification of tdTomato+EdU+ (B) or tdTomato+Osx+ (D) over tdTomato+ cells in areas represented by (A) or (C), respectively. Percentage (mean ± SD) was quantified within the primary spongiosa of the proximal tibia, extending 300 μm from the growth plate and across the width of the bone in two sections per mouse and three mice per group.
(E) μCT images of cancellous bone of the proximal tibia in wild-type mice with indicated treatments for 10 days. Scale bar: 100 μm.
(F) Quantification of the trabecular bone mass (BV/TV) by μCT.
(G and H) Serum levels of bone formation (G) or resorption (H) markers.
(I) Representative images of double labeling for bone formation on the endosteal surface of the tibia. Green, calcein; red, alizarin red.
(J) Quantification of the mineral apposition rate (MAR) at the endosteal bone surface from double-labeling experiments.
Error bars: SD. *p < 0.05, n = 3, two-way ANOVA.