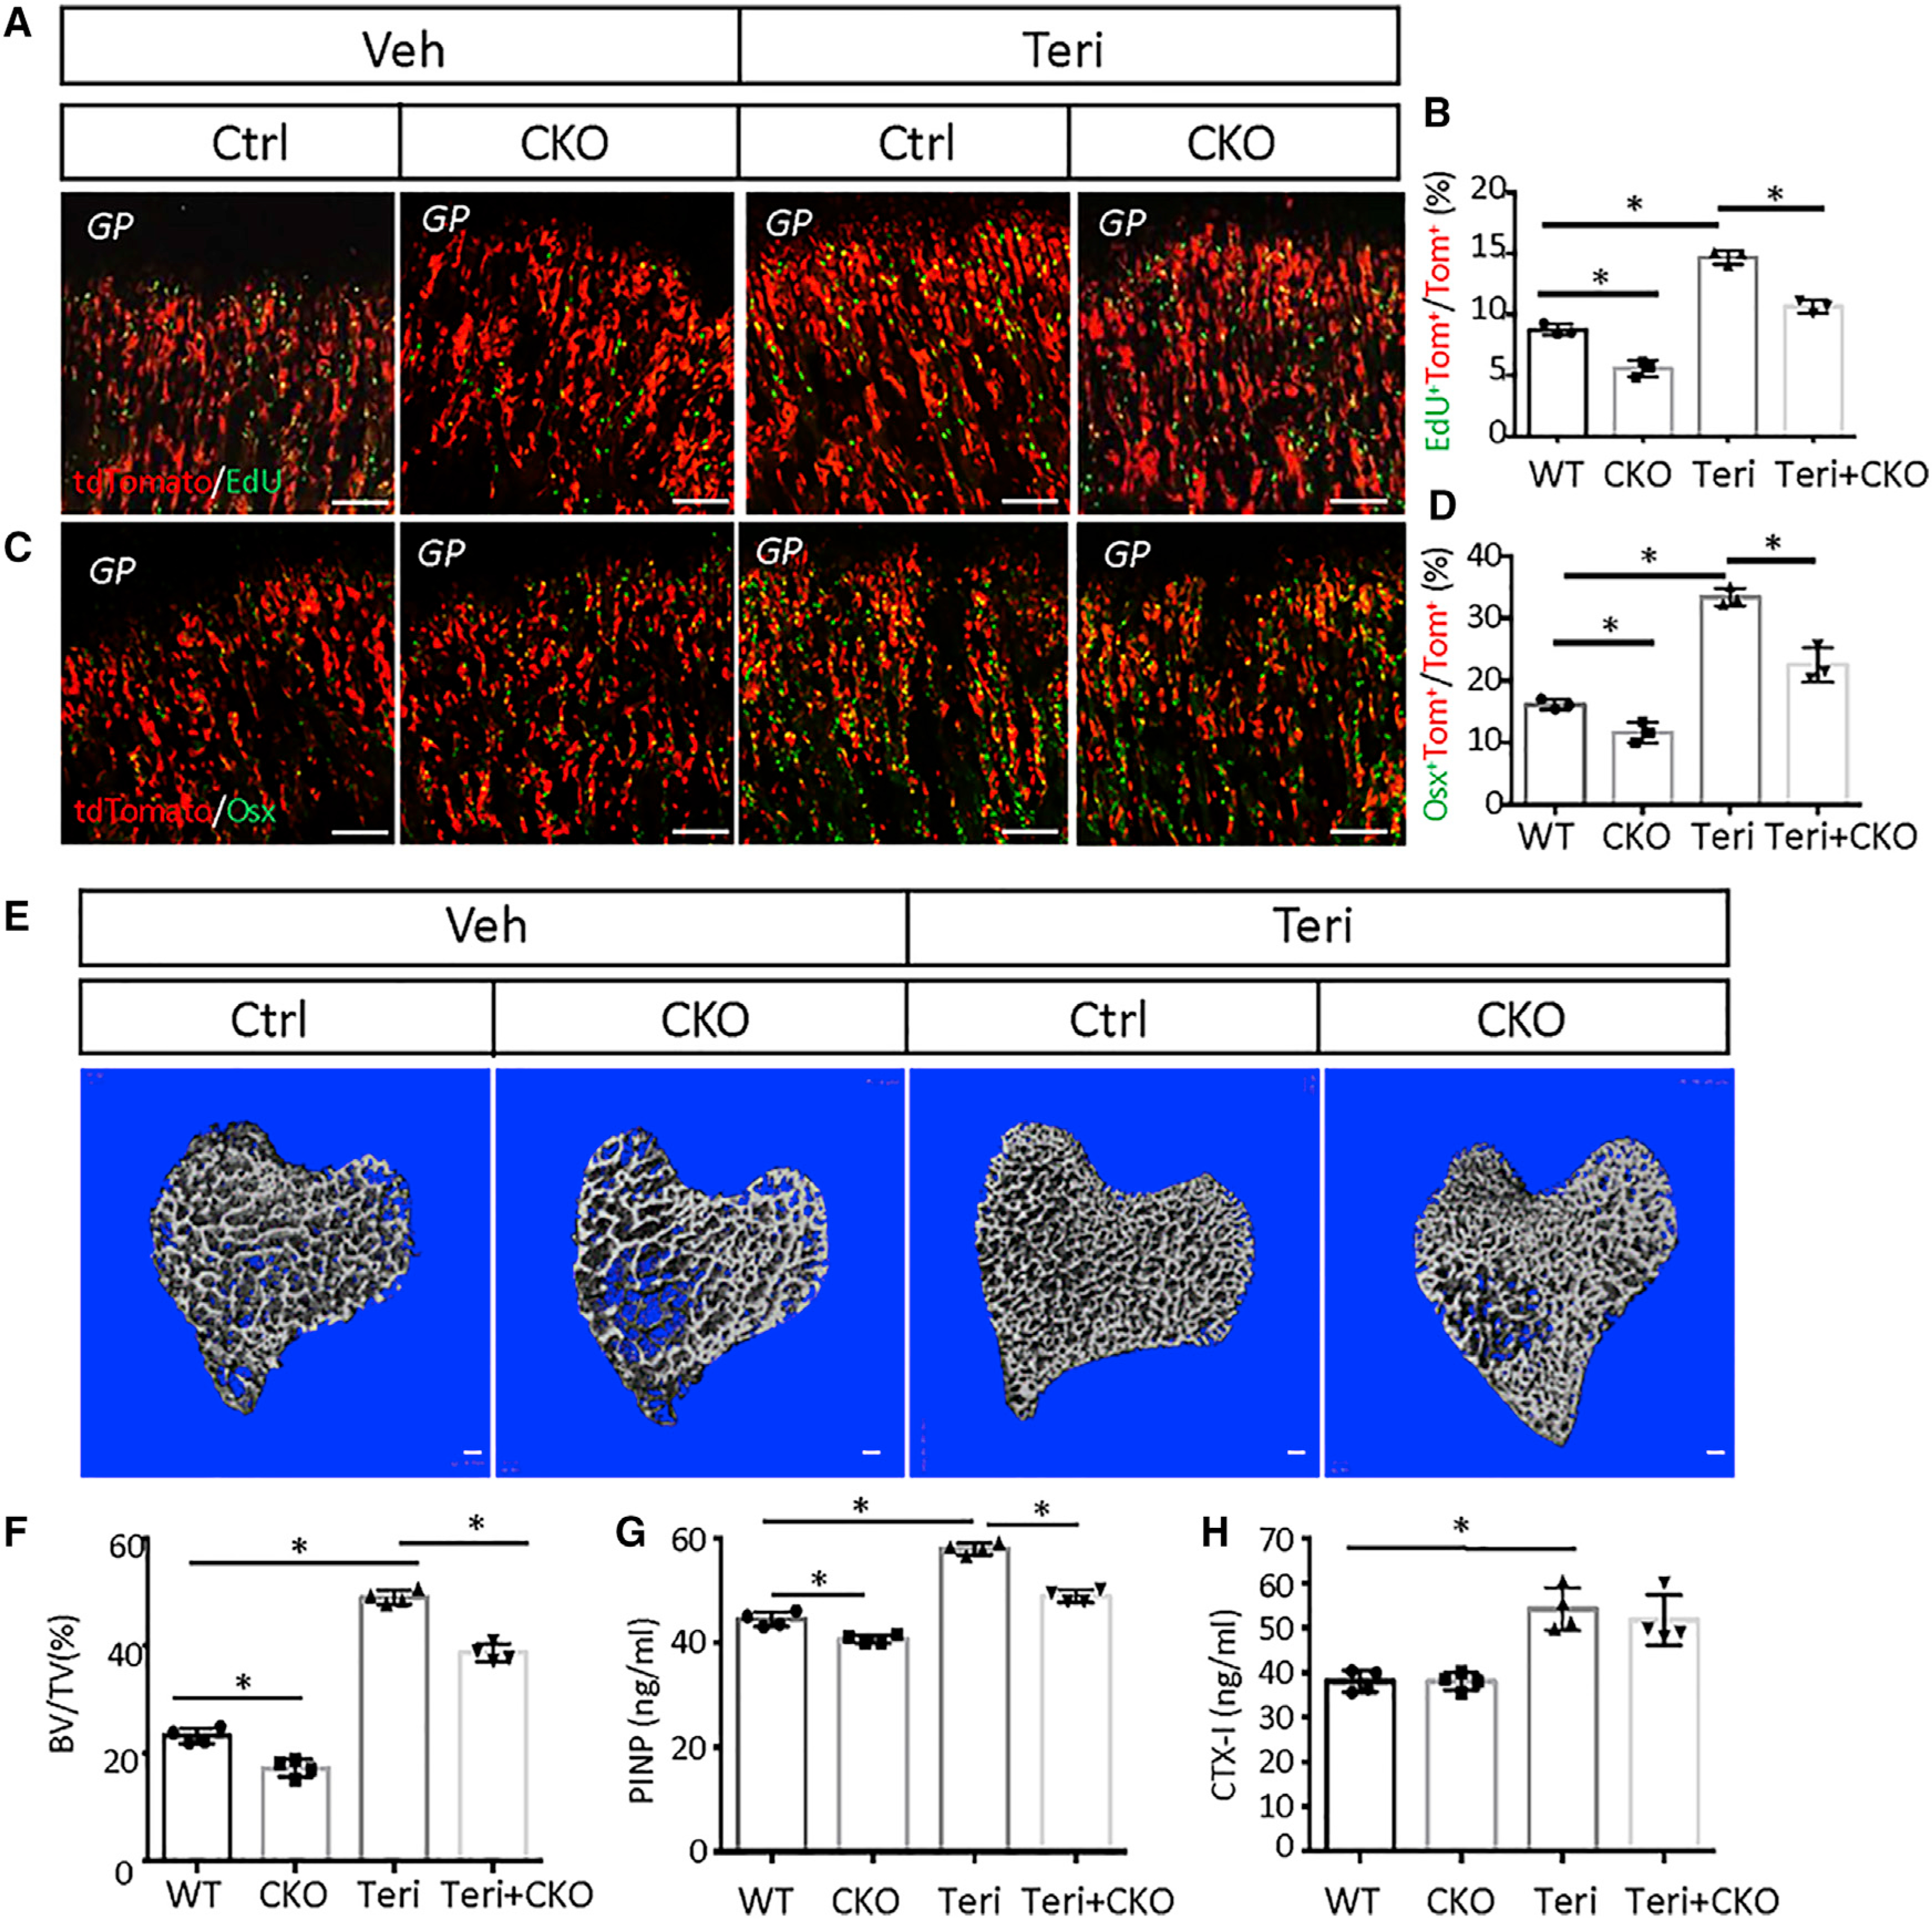
Figure 7. Igf signaling mediates effects of teriparatide on MMPs and bone formation.

(A and C) Representative confocal images of the chondro-osseous junction in the distal femur. Mice with the genotype of Gli1-CreERT2;Ai9;Igf1rc/+ (Ctrl) or Gli1-CreERT2;Ai9;Igf1rc/c (CKO) were injected with teriparatide or vehicle for three days after TAM treatment. Scale bar: 100 μm.
(B and D) Quantification of tdTomato+EdU+ (B) or tdTomato+Osx+ (D) over tdTomato+ cells in areas represented by (A) or (C), respectively. Percentage (mean ± SD) was quantified within the primary spongiosa region extending 300 μm from the growth plate of the proximal tibia and spanning the width of the bone, in two sections per mouse and three mice per group. Error bar: SD. *p < 0.05, n = 3, two-way ANOVA.
(E) μCT images of cancellous bone of the proximal tibia. Ctrl or CKO mice were injected with teriparatide or vehicle for 21 days. Scale bar: 100 μm.
(F) Quantification of BV/TV by μCT. Error bar: SD. *p < 0.05, n = 4, two-way ANOVA.
(G and H) Serum levels of bone formation (G) or resorption (H) markers. Error bar: SD. *p < 0.05, n = 4, two-way ANOVA.
