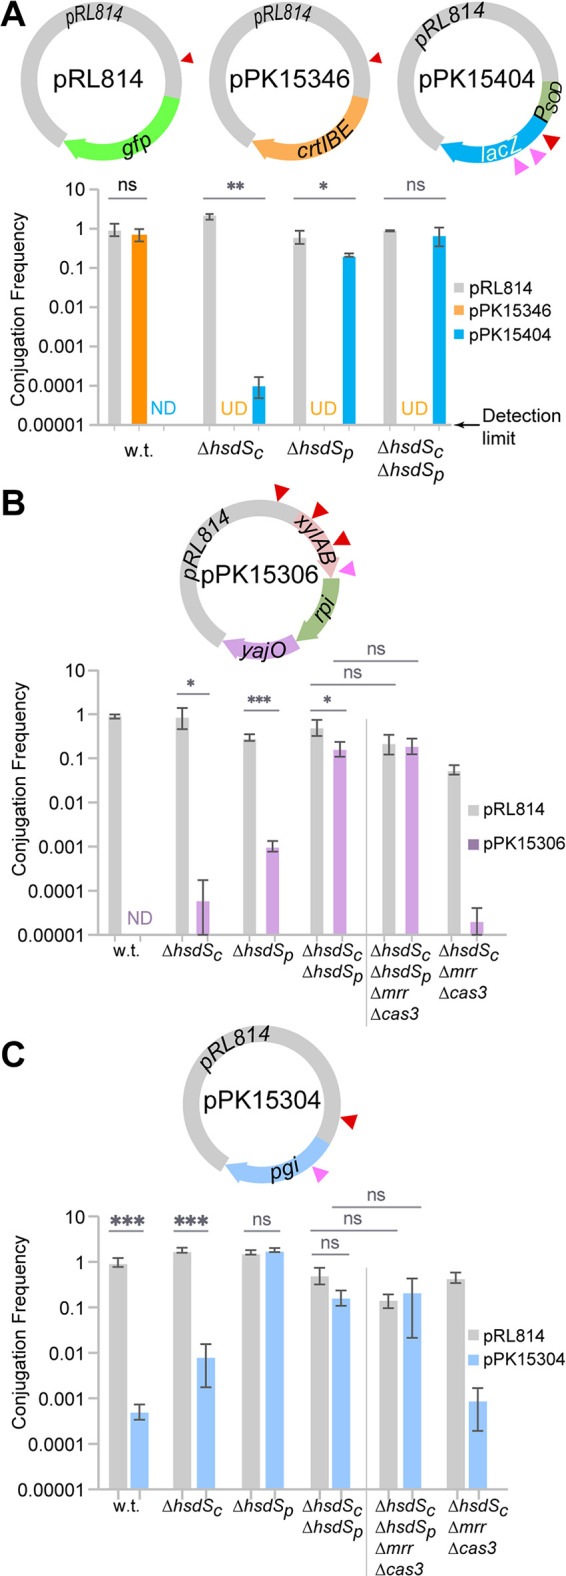
FIG 4.

Role of HsdSc, HsdSp, Mrr, and Cas3 in restricting pPK15404, pPK15306, and pPK15304. (A) The frequency of conjugation of pRL814 into Z. mobilis ZM4 (0.78× 10⁻³ ± 0.09 × 10⁻³) served as a normalization factor for comparing the conjugation frequency (y axis) of the other plasmids in wild-type (w.t.) and mutant ZM4 strains. (B) The frequency of conjugation of pRL814 into Z. mobilis ZM4 (0.24 × 10⁻³ ± 0.08 × 10⁻³) served as a normalization factor for comparing the conjugation frequency (y axis) of plasmids in wild-type (w.t.) and mutant ZM4 strains as indicated. (C) The frequency of conjugation of pRL814 into Z. mobilis ZM4 (6 × 10⁻³ ± 0.6 × 10⁻³) served as a normalization factor for comparing the conjugation frequency (y axis) of plasmids in wild-type (w.t.) and mutant ZM4 strains. When conjugation of a plasmid was below the limit of detection (0.00001), the sample is marked “ND” (not detected). When conjugation experiment of a plasmid was not done, it is marked “UD” (undetermined). Error bars represent the standard deviations of the conjugation frequency means obtained from three independent experiments. Statistical significance was determined using a paired Student's t test (*, P < 0.05; **, P ≤ 0.01; ***, P ≤ 0.001; ns, not significant). On the plasmids, red triangles represent restriction sites recognized by HsdSc and pink triangles represent restriction sites recognized by HsdSp.
