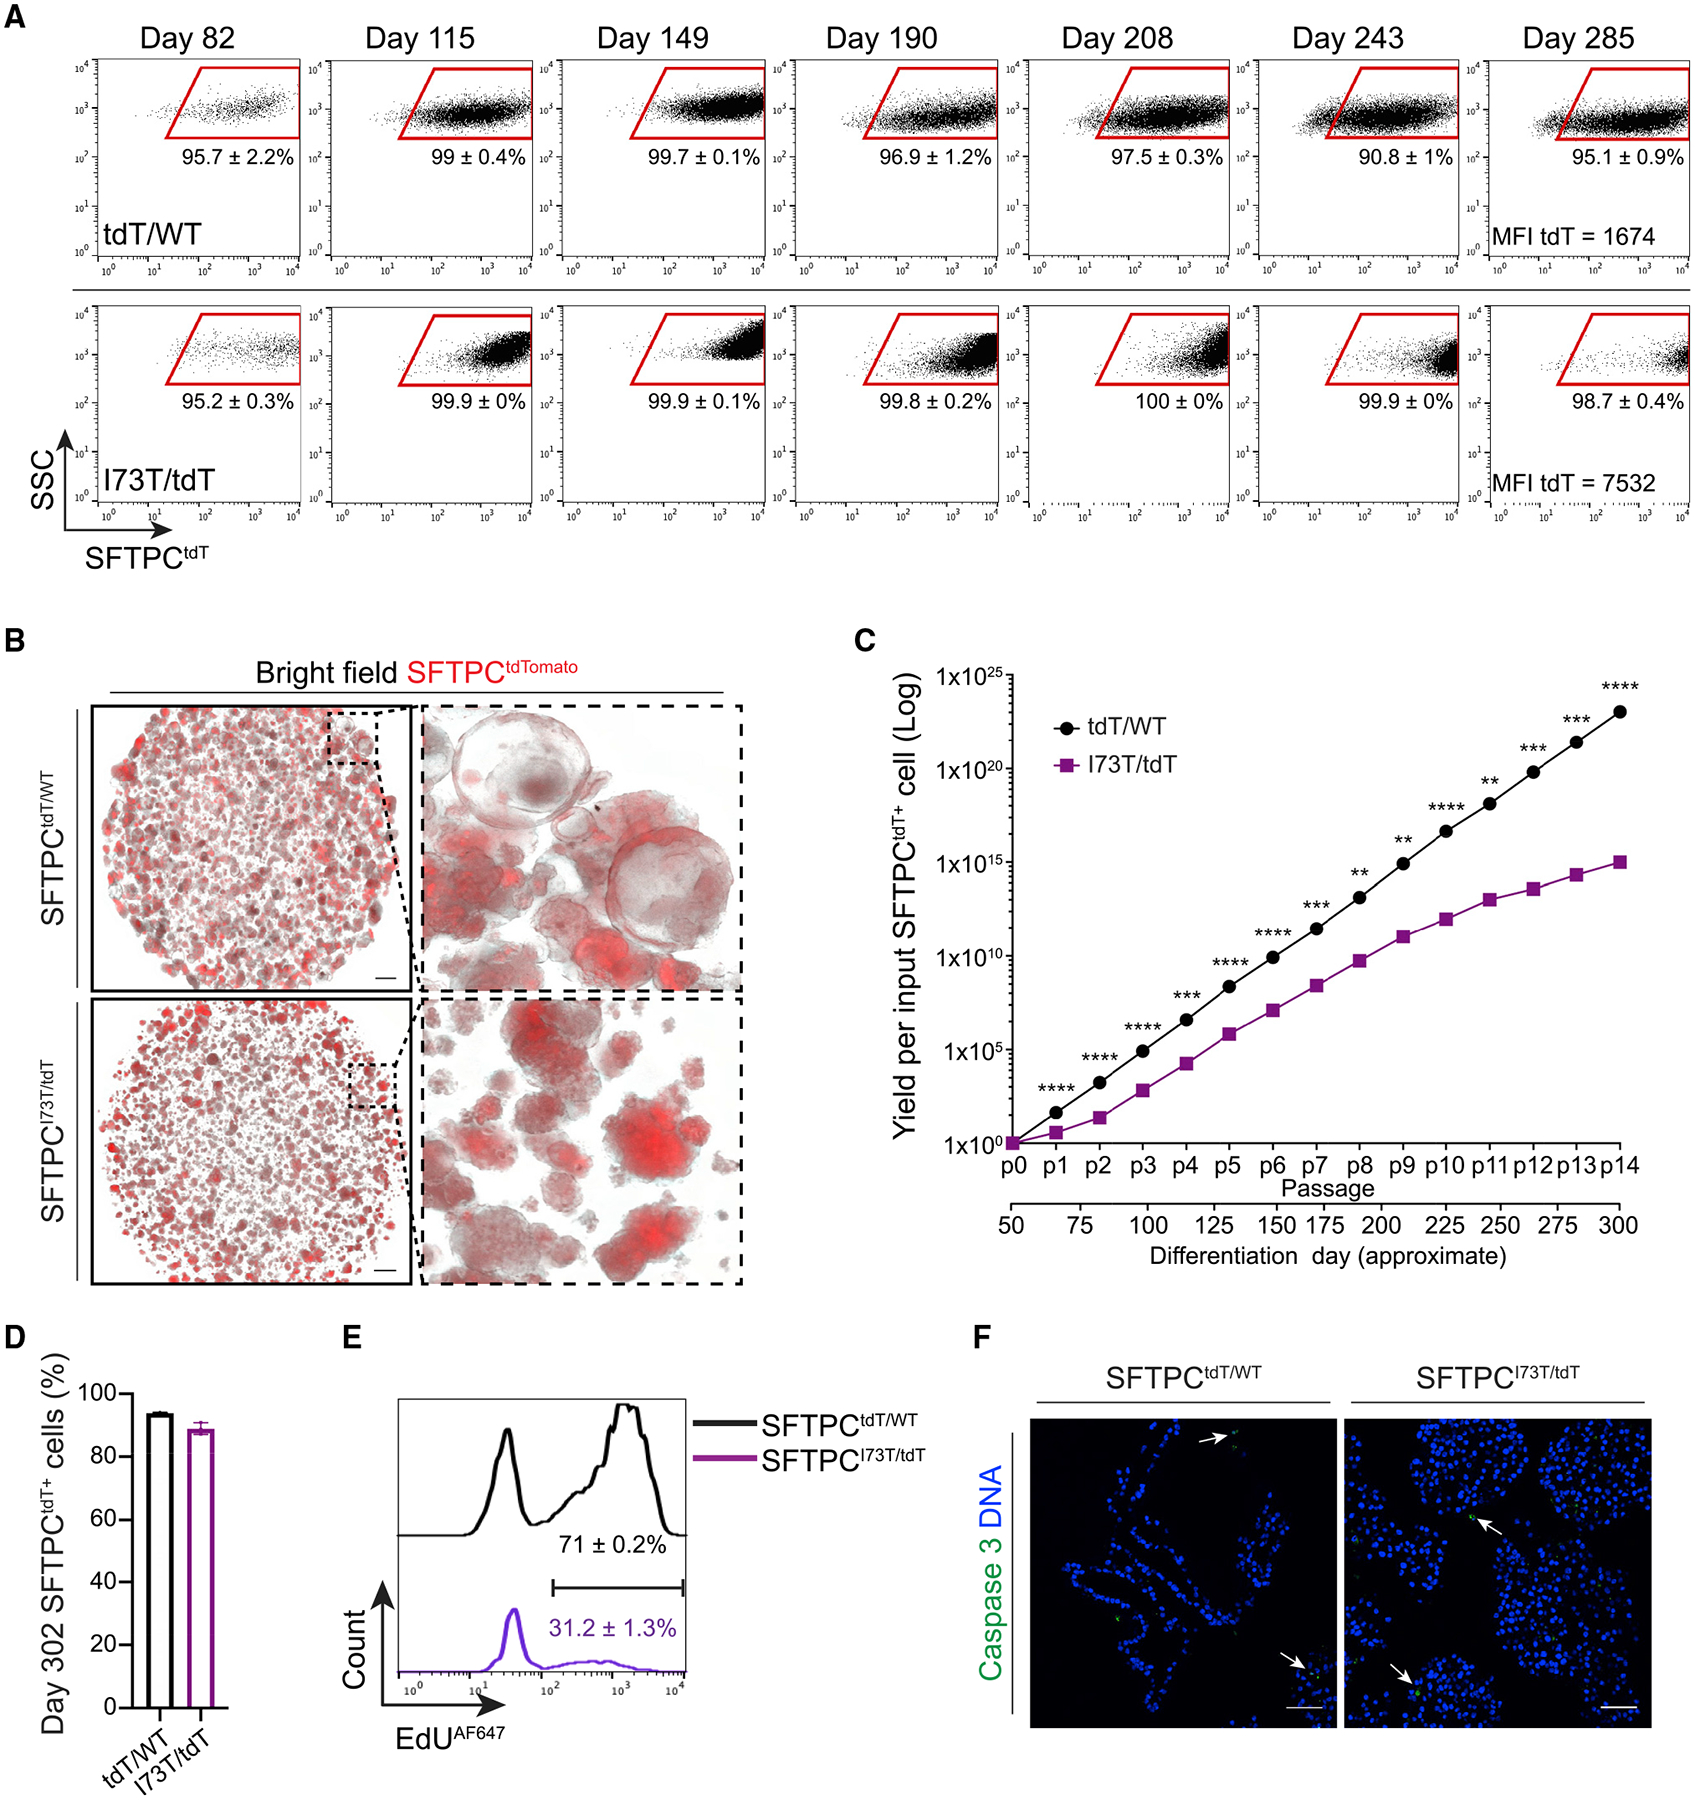
Figure 2. Derivation of parallel self-renewing corrected (SFTPCtdT/WT) and mutant (SFTPCI73T/tdT) iAEC2s.

(A) Representative flow cytometry dot plots of day 82 (p2), day 115 (p4), day 149 (p6), day 190 (p8), day 208 (p9), day 243 (p11), and day 285 (p13) SFTPCtdT/WT and SFTPCI73T/tdT iAEC2s. MFI, mean fluorescence intensity.
(B) Representative live-cell imaging of SFTPCtdT/WT and SFTPCI73T/tdT alveolospheres (bright-field/tdTomato overlay; day 149). Scale bars, 500 μm.
(C) Graph showing yield per input tdT/WT or I73T/tdT SFTPCtdTomato+ cell sorted on day 51 and passaged without further sorting. **p < 0.01, ***p < 0.001, ****p < 0.0001 by unpaired, two-tailed Student’s t test.
(D) Bar graph shows retention of the AEC2 cell fate in SFTPCtdT/WT and SFTPCI73T/tdT iAEC2s maintained in culture for 302 days, measured by flow cytometry as the frequency of cells expressing the SFTPCtdTomato reporter.
(E) Histograms show higher proliferation rates in SFTPCtdT/WT compared to SFTPCI73T/tdT iAEC2s, measured by flow cytometry as the frequency of SFTPCtdTomato+ cells that incorporate EdU.
(F) Representative confocal immunofluorescence microscopy of SFTPCtdT/WT and SFTPCI73T/tdT iAEC2s stained for activated caspase 3 (green) and DNA (Hoechst, blue) shows absence of significant apoptosis. Scale bars, 50 μm.
(A and C–E) Mean ± SD is shown; n = 3 experimental replicates of independent wells of a differentiation.
