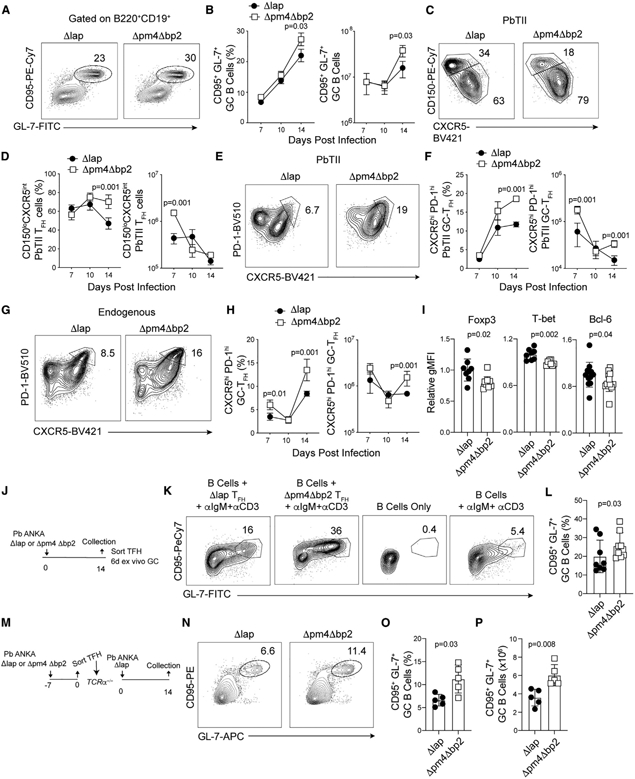
Figure 3. Hemozoin impairs the germinal center response.

Parasite-specific CD4 T cells (PbTII) were transferred to C57BL/6 mice 1 day prior to infection with either Δpm4Δbp2 or Δlap parasites. Splenic TFH and GC B cell responses were evaluated.
(A–F) Representative plots (A) and frequency and number (B) of GC B cells (B220+CD19+CD95+GL-7+) on d14 p.i. TFH precursors (CD150loCXCR5int) (C and D) and mature GC-TFH (CXCR5hiPD-1hi) expansion (E and F) among donor-derived PbTII cells.
(G and H) Frequency (G) and summary quantification (H) of mature GC-TFH (PD-1hiCXCR5hi) among polyclonal endogenous CD4 T cells.
(I) Relative expression (gMFI) of Foxp3, T-bet, and Bcl-6 in polyclonal GC-TFH cells on day 14 p.i.
(J) Polyclonal GC-TFH cells were sort purified from spleens day 14 p.i. and co-cultured for 6 days with purified naive B cells.
(K and L) Representative flow plots (K) and summary (L) of GC B cell (B220+CD19+CD95+GL-7+) frequency following co-culture.
(M) Polyclonal TFH cells were sort purified from spleens of Δpm4Δbp2 and Δlap-infected mice day 7 p.i. and transferred to Tcrα−/− mice. Tcrα−/− mice were infected with Δlap parasites and GC responses were assessed on 14 p.i.
(N–P) Representative flow plots (N) and summary of GC B cell (B220+CD19+CD95+GL-7+) frequency (O) and number (P).
Data (mean ± SEM) in (A)–(H) are representative of four experiments with n = 4–5. Data (mean ± SD) in (J)–(L) are the summary data from two independent experiments. Data (mean ± SD) in (M)–(P) are representative of two independent experiments with n = 5 (see also Figure S2).
