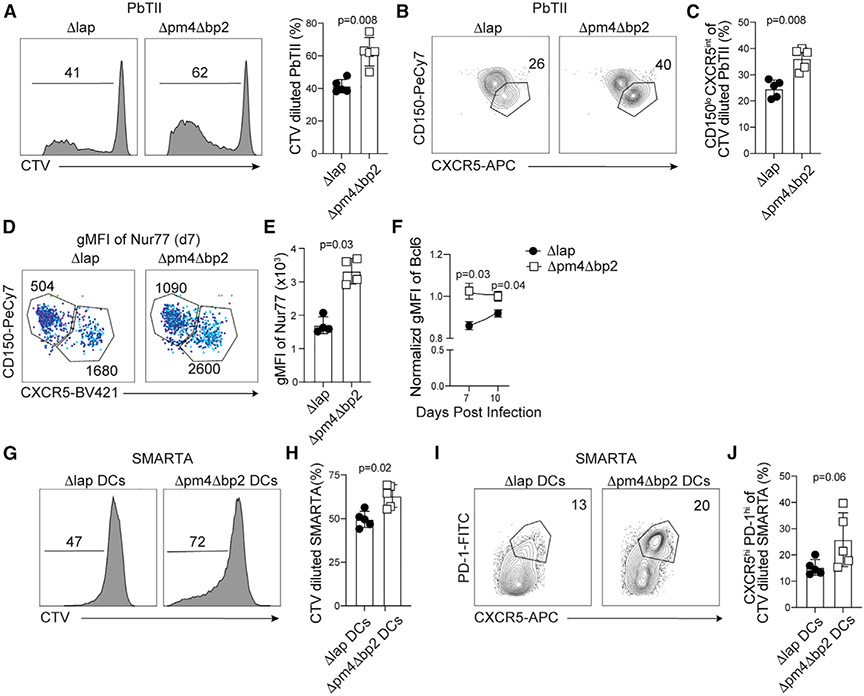
Figure 5. Optimal TFH expansion is impaired by hemozoin.
CTV-labeled PbTII cells were transferred into mice 1 day prior to infection with either Δpm4Δbp2 or Δlap-infected parasites and harvested 4 days later.
(A) Representative histograms and quantification of CTV dilution among PbTII cells.
(B and C) Flow plots (B) and summary (C) of CD150 and CXCR5 expression by CTV diluted PbTII.
(D) gMFI of Nur77 in CD150loCXCR5intTFH and CD150hiCXCR5loTH1 PbTII CD4+ T cells on day 7 p.i. with light blue corresponding to increased gMFI. Numbers on flow plots are gMFI.
(E) Summary of Nur77 gMFI among CD150loCXCR5intTFH
(F) Normalized Bcl-6 expression by PbTII TFH collected on days 7 and 10 p.i. with Δpm4Δbp2 or Δlap. CTV-labeled SMARTA cells were cocultured for 4 days with GP-66 pulsed cDCs isolated from either Δpm4Δbp2 or Δlap-infected mice.
(G and H) Histogram of CTV dilution (G) and summary (H) data collected from SMARTA cells on d4 of in vitro culture.
(I and J) Flow plots (I) and summary (J) of PD-1 and CXCR5 expression by CTV diluted SMARTA cells.
Data (mean ± SD) are representative of two independent experiments with n = 4–5 (see also Figure S4).

