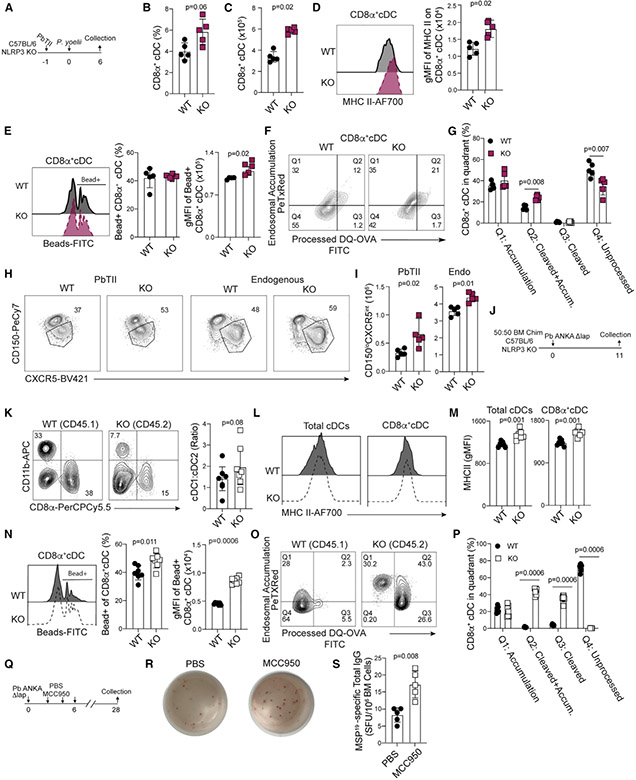
Figure 7. Hemozoin impairs dendritic functions via cell-intrinsic NLRP3 activity.
(A) Experimental design for samples depicted in (B)–(I) from C57BL/6 (WT) and NLRP3−/− (KO) mice infected with P. yoelii 17XNL parasites.
(B and C) Summary CD11bnegCD8α+ cDC1 frequency (B) and number (C) in WT and NLRP3 KO mice.
(D) Histogram and summary of MHC II expression in CD8α+ cDC1.
(E) Histograms of bead uptake, summary graph of the frequency of bead positive CD8α+ cDC1 (center), and gMFI of phagocytosed beads (right).
(F and G) Flow plots (F) and summary (G) of DQ-OVA antigen processing assay. The frequency of CD11bnegCD8α+ cDC1 in each quadrant is depicted.
(H and I) Flow plots (H) and number (I) of CD150loCXCR5int TFH among parasite-specific (left) and polyclonal (right) CD4 T cells on day 6 p.i.
(J) Experimental schematic for C57BL/6:NLRP3−/− (50:50) bone-marrow chimera generation.
(K) Ratio of CD11b+CD8αneg cDC2 and CD11bnegCD8α+ cDC1 recovered from chimeras on d11 p.i.
(L and M) Histograms and quantification of MHC II expression by total cDC and CD11bnegCD8α+ cDC1.
(N) Flow plots of bead uptake (left), summarized frequency of fluorescent bead+ CD11bnegCD8α+ cDC1 (center), and gMFI of fluorescent beads are quantified (right).
(O) DQ-OVA antigen-processing assay.
(P) The frequency of CD11bnegCD8α+ cDC1 in each quadrant is quantified.
(Q) C57BL/6 (WT) mice were administered either MCC950 or PBS i.p. during the first 6 days of infection, and bone marrow was collected on day 28 for quantification of MSP19 LLPC via ELISPOT.
(R and S) Representative ELISPOT photos (R) and summary data (S).
Data (mean ± SD) in (A)–(I) and (Q)–(S) are representative of two independent experiments with n = 5. Data (mean ± SD) in (K)–(P) are the summary data collected from two independent experiments (see also Figure S6).

