
Figure 6. eQTS analyses.
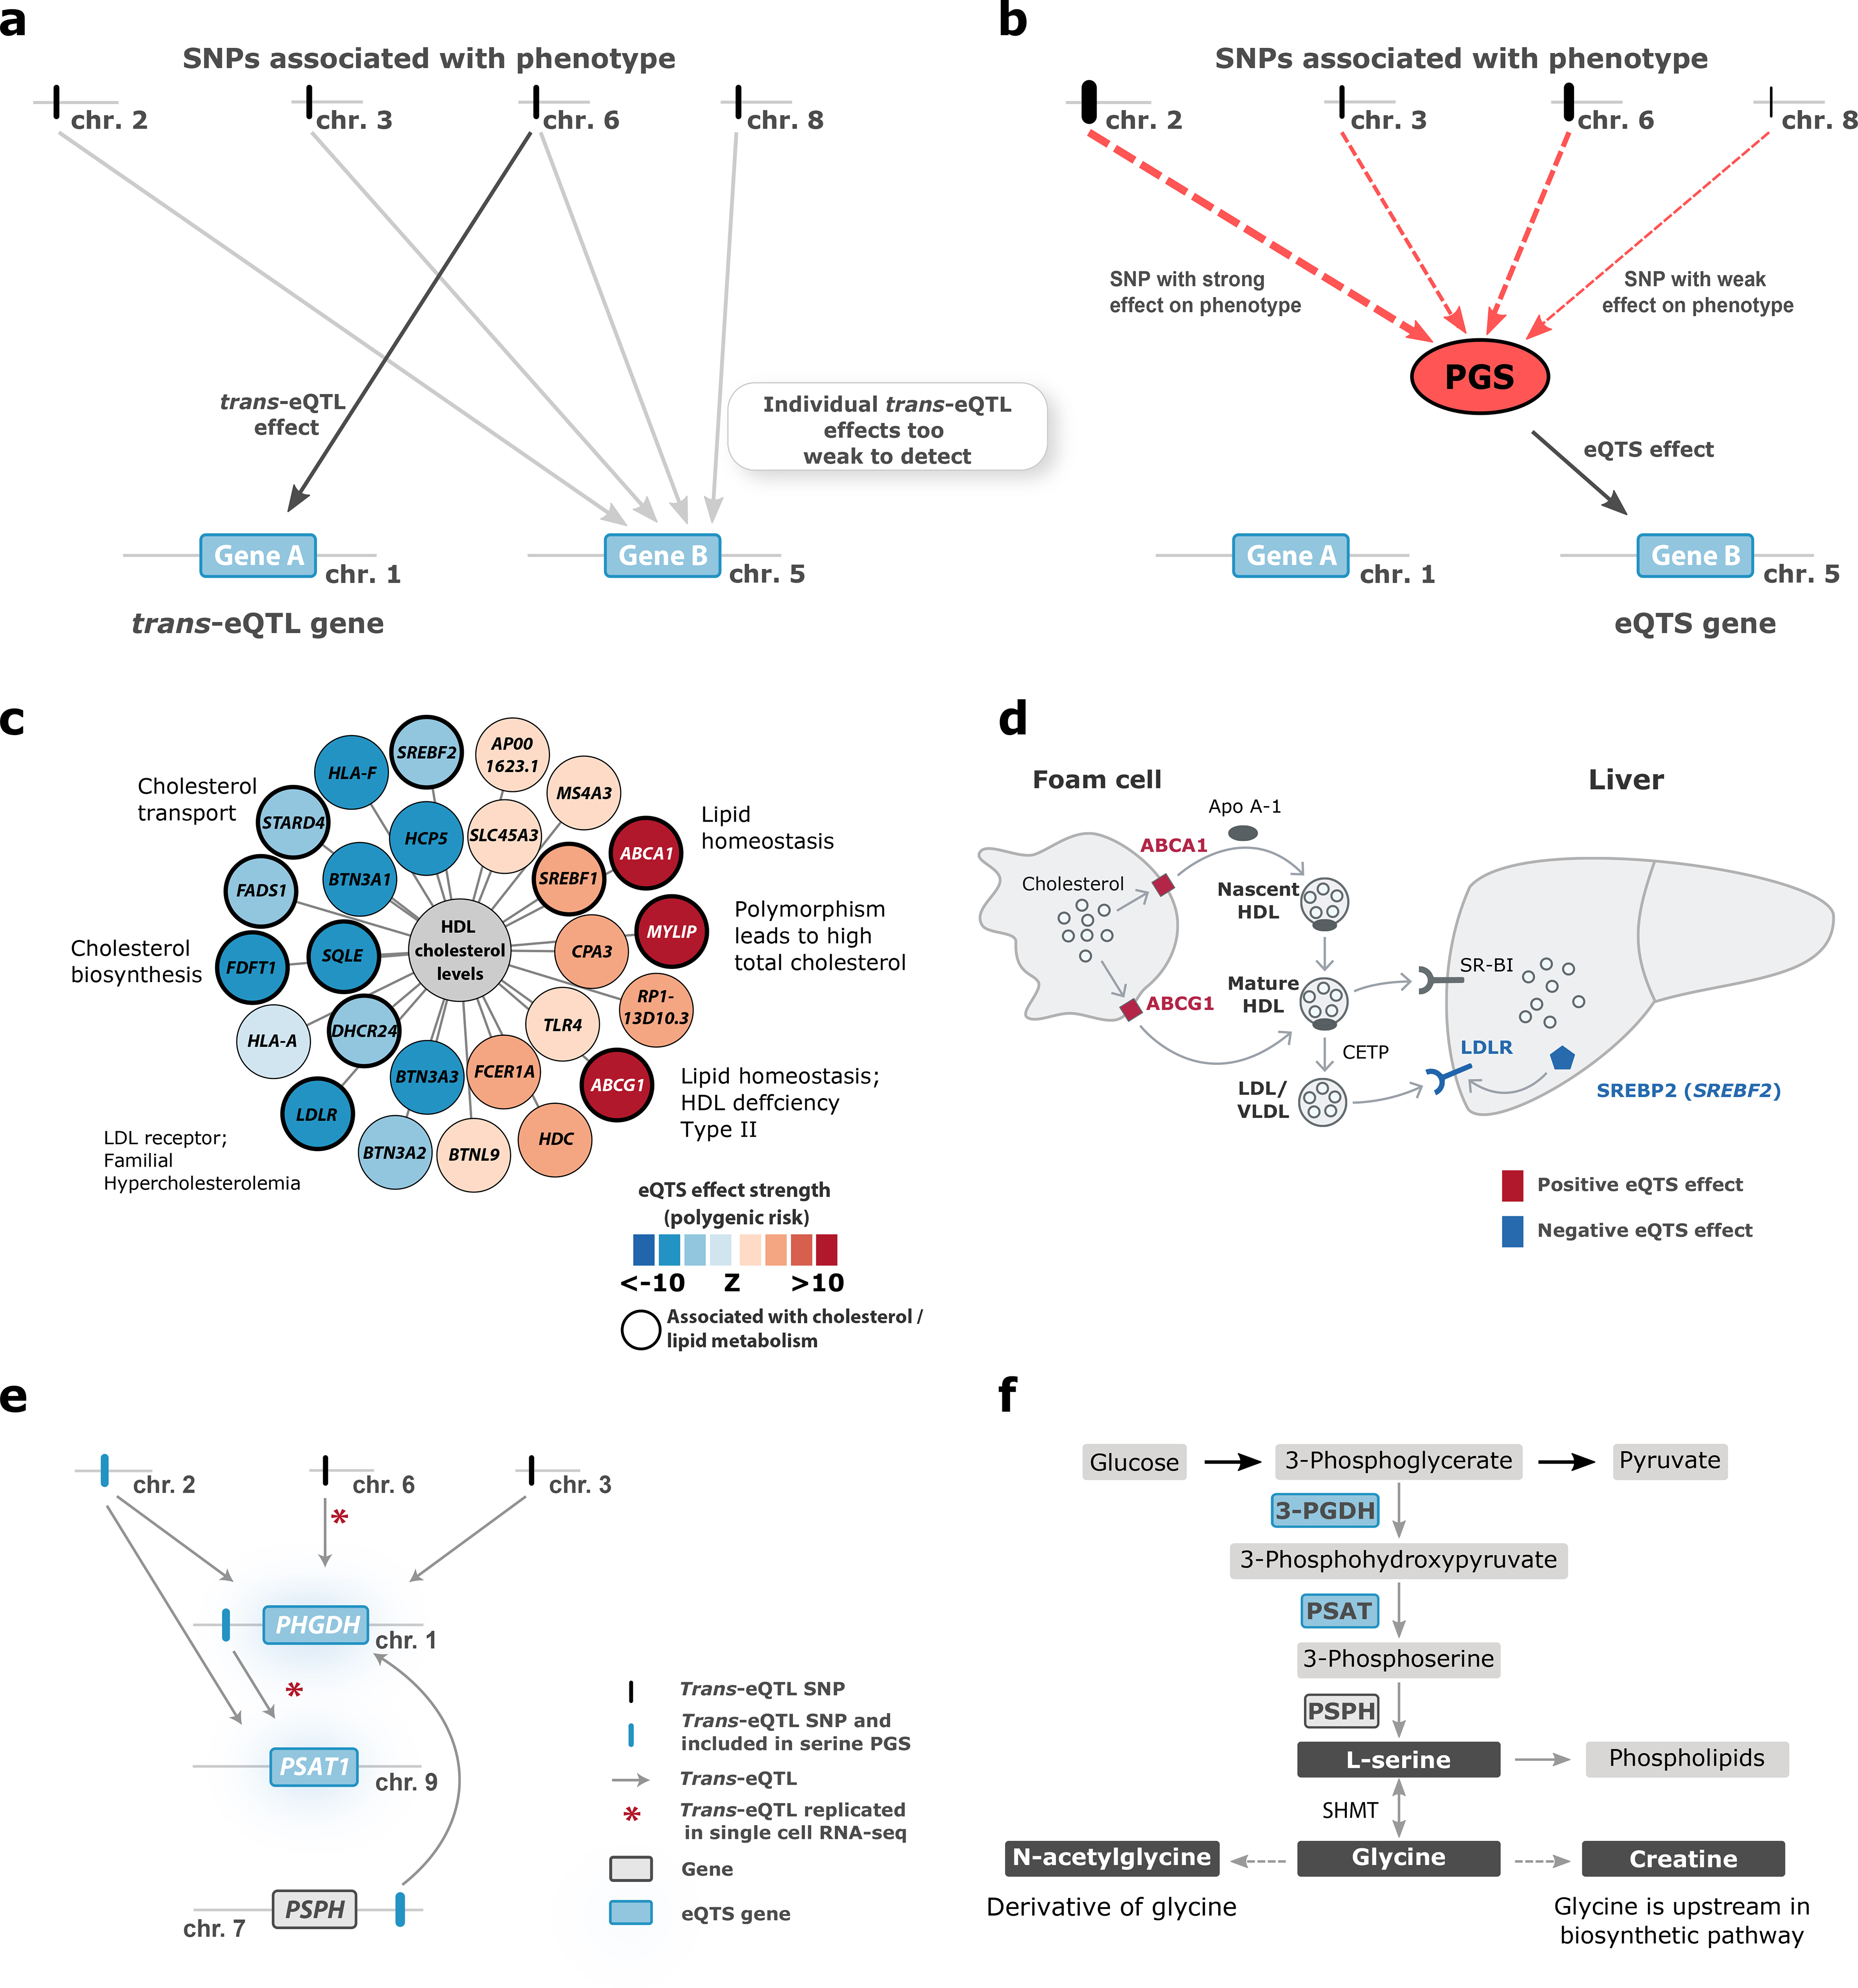
(a) In trans-eQTL analysis, individual SNPs are associated with gene expression. (b) In eQTS analysis, the effect sizes and directions of individual trait-associated SNPs are combined into a polygenic score (PGS) that is associated with gene expression. Here, we outline the case where eQTS analysis identifies a gene not detectable in the trans-eQTL analysis. Other scenarios we observed include: Gene A also being identified by eQTS analysis, Gene B being identified by both methods, or the combined effect of PGS yielding no significant eQTS. (c) The PGS for high density lipoprotein (HDL) associates to lipid metabolism genes. (d) The role of ABCA1, ABCG1, LDLR and SREBF2 in cholesterol transport. (e) Both trans-eQTLs and the serine PGS associate with the known serine biosynthesis genes PHGDH and PSAT1. (f) Serine biosynthesis pathway.