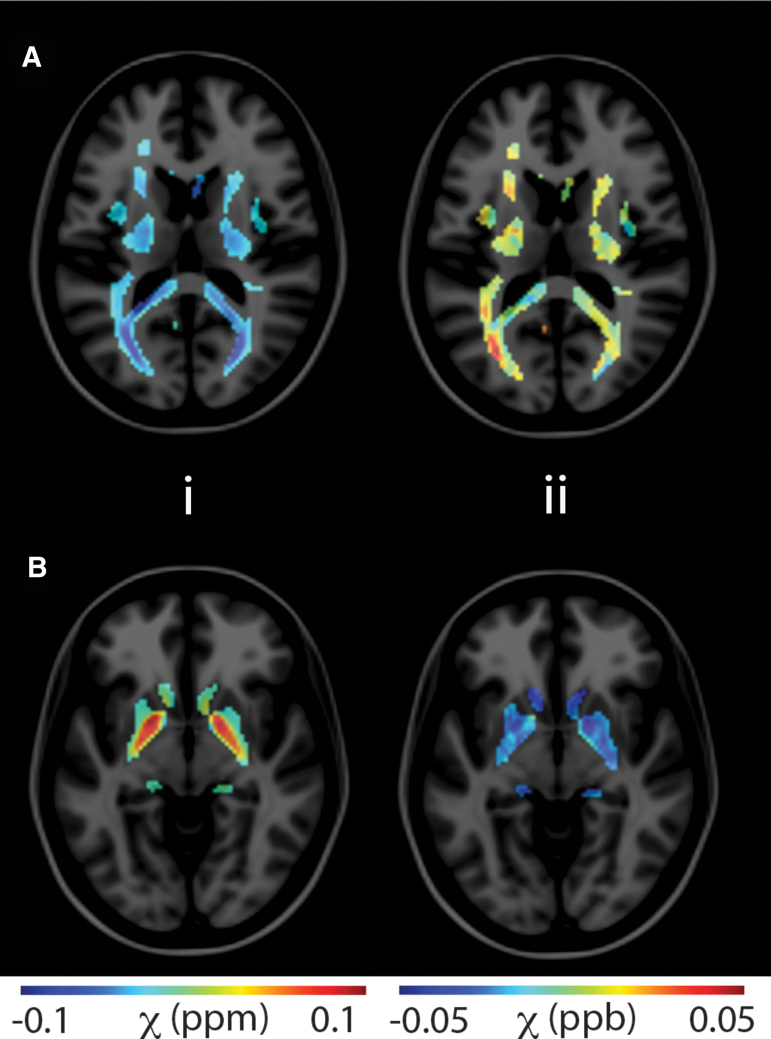
FIG. 2.
Representative quantitative susceptibility maps (QSM) for two axial slices demonstrating changes in the white matter (A) and subcortical gray matter compartments (B). Column i displays mean control QSM masked within respective tissue compartments. Column ii provides masked difference QSM from an injured subject relative to the control QSM mean. Masks are derived from MNI atlases and externally derived QSM stability maps. Color image is available online.

