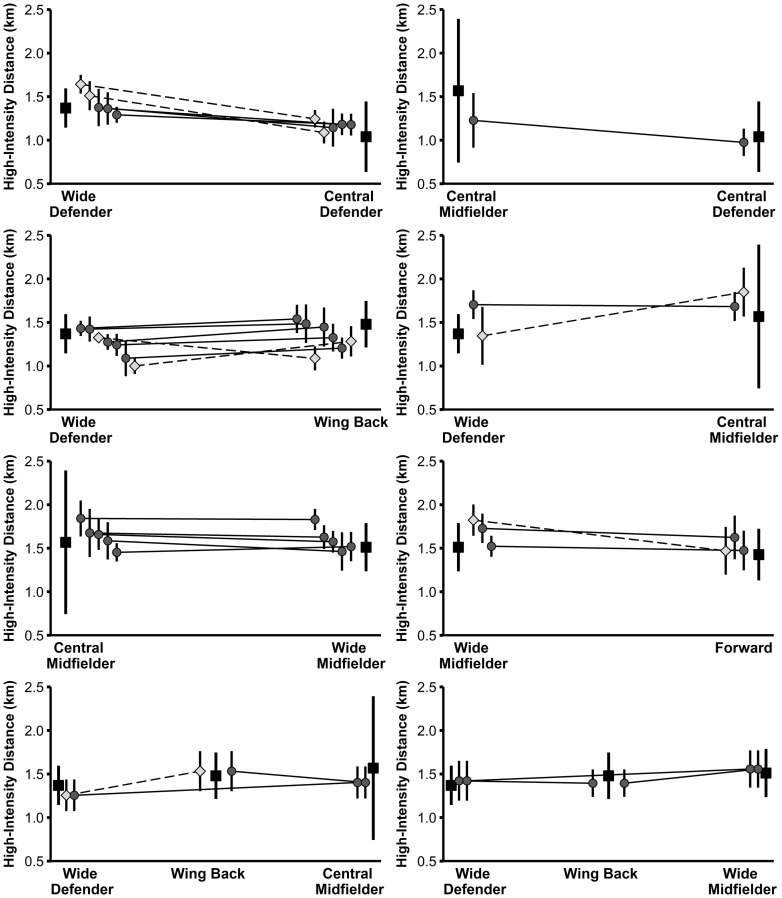
Fig 2. High-intensity distance of players from the study sample (grey diamonds and circles) in relation to normative positional data (black squares).
Data are presented as mean values ± SD. Light grey diamonds and dashed lines indicate significant differences in performance between the two positions for the respective player.

