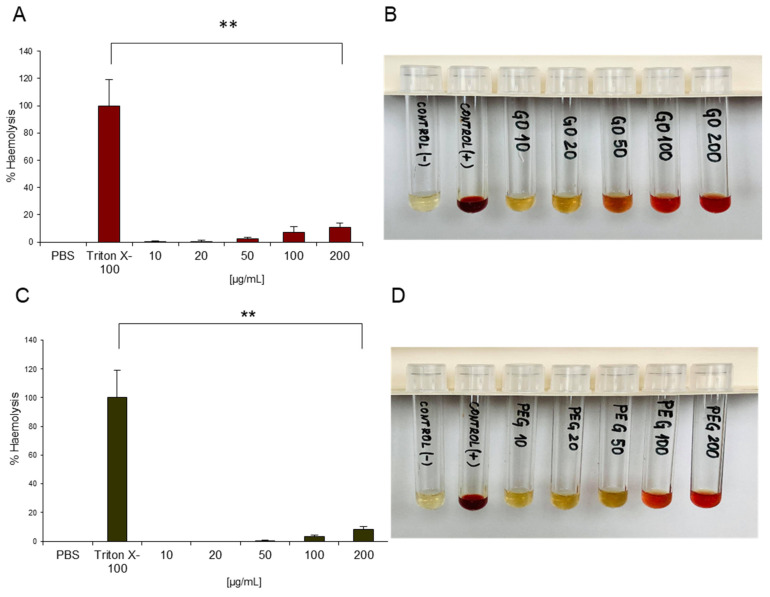
Figure 2.
Haemolytic activity of nGO and nGO-PEG NPs. Percentage of haemolysis induced by nGO (A) and nGO-PEG (C), respectively. Visual inspection via optical images of the tubes containing diluted total blood after exposure to nGO (B) or nGO-PEG (D) for 3 h after centrifugation. PBS and Triton-X-100 were, respectively, used as negative control and positive control. ** p < 0.01 denotes significantly different results from the negative control.

