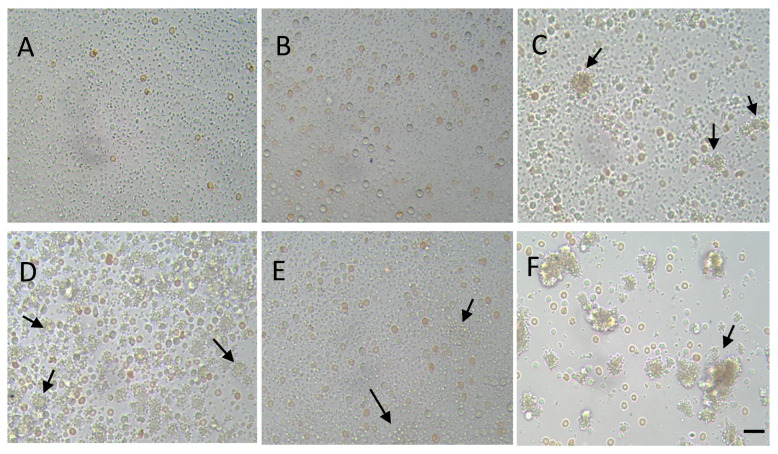
Figure 5.
Phase-contrast micrographs of unstimulated (A–C) and ADP-stimulated (D–F) platelets, treated with nGO (B,E) and nGO-PEG (C,F) NPs. A quantity of 100 μg/mL of nGO and nGO-PEG nanoparticles were co-incubated with platelet-rich plasma and pplatelet activation was induced by addition of 50 µM/mL of adenosine diphosphate (ADP). Arrows show platelet aggregates. Scale bar: 20 μm.

