
FIG 6.
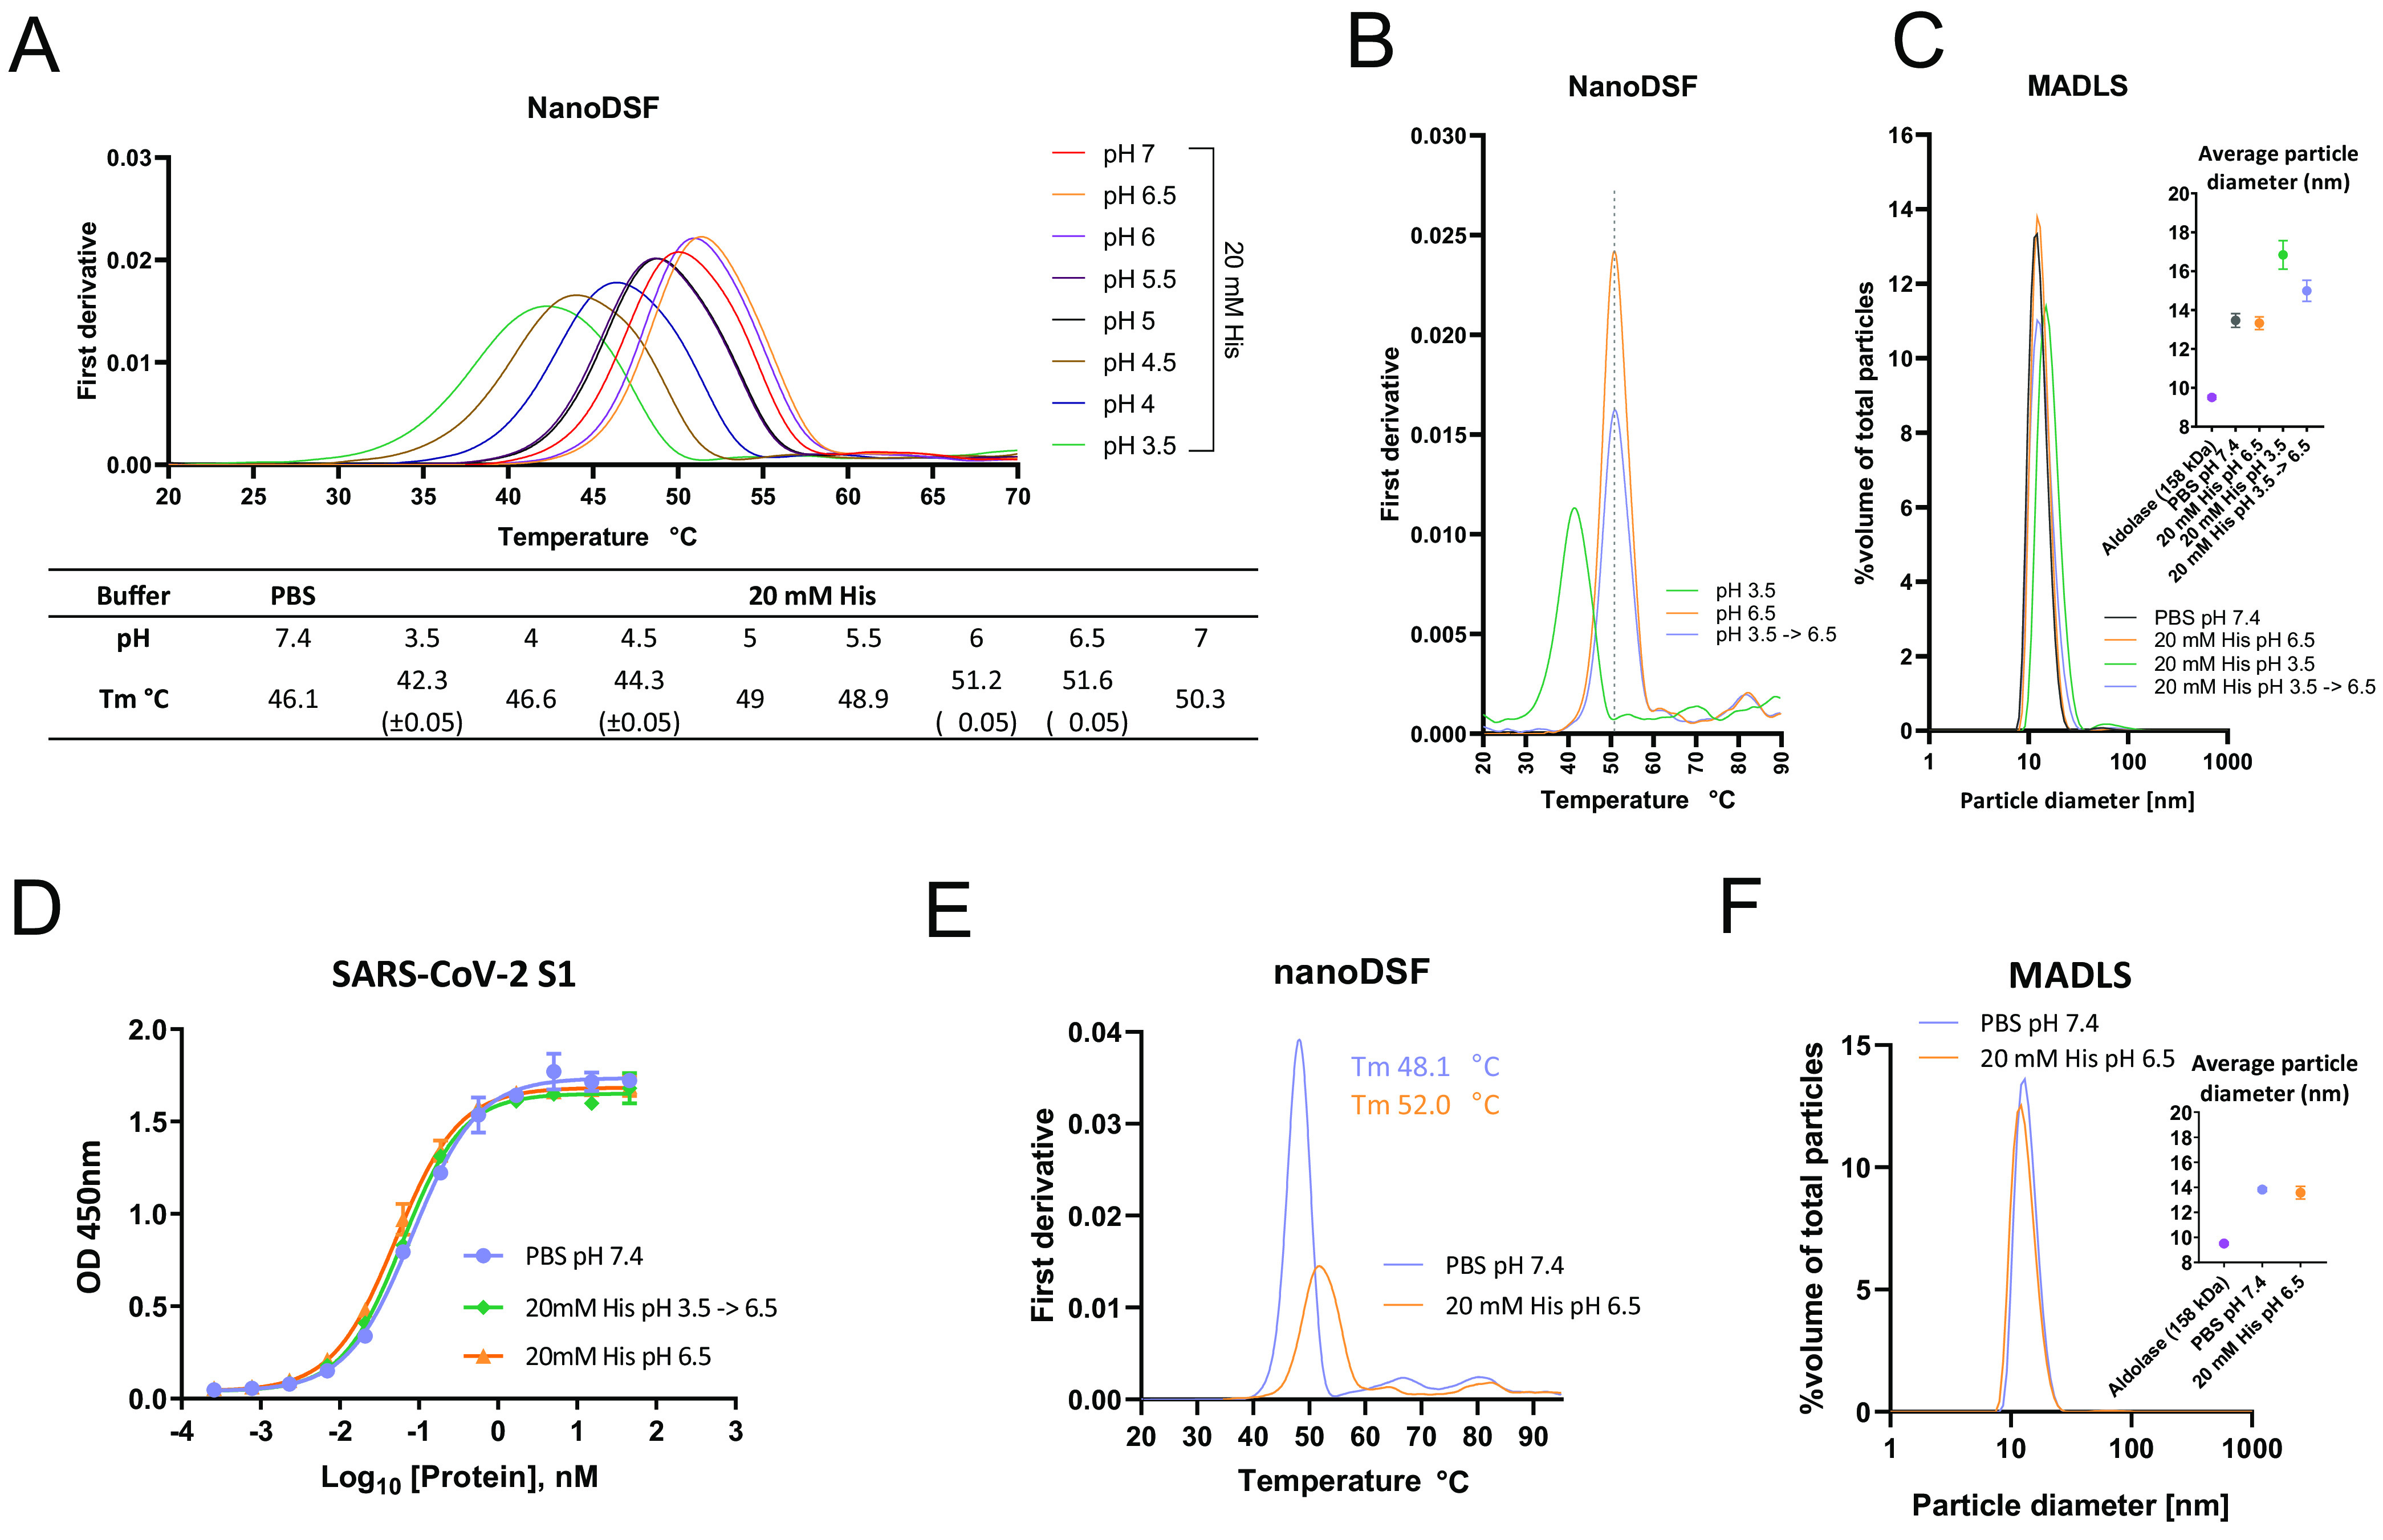
ACE2-Fc formulation optimization. (A) Thermal stability analysis via nanoDSF of ACE2(HH:NN)-Fc in PBS at pH 7.4 or in 20 mM His buffer with pH range of 3.5 to 7. Highest stability obtained with 20 mM His (pH 6.5). (B) Thermal stability of ACE2(HH:NN)-Fc in 20 mM His pH 6.5 (orange) and 3.5 (green) following 2 h of incubation at RT. Full stability could be recovered following buffer exchange of ACE2(HH:NN)-Fc from pH 3.5 to pH 6.5 (blue). (C) Particle size distribution analysis via MADLS of ACE2(HH:NN)-Fc at 1 mg/ml in PBS (pH 7.4), 20 mM His *(pH 3.5, 6.5), or buffer exchanged from pH 3.5 to 6.5. Increase of particle size of sample at pH 3.5 was partially recovered upon buffer exchange in 20 mM His (pH 6.5) (mean ± SD). (D) ACE2(HH:NN)-Fc binding capacity for SARS-CoV-2 S1 in ELISA in PBS (pH 7.4; blue), 20 mM His (pH 6.5; orange), or 20 mM His (pH 3.5) followed by buffer exchange in 20 mM His (pH 6.5; green) (mean ± SD). (E) Thermal stability analysis via nanoDSF of ACE2(HH:NN)-Fc (LALA-PG) in PBS at pH 7.4 (blue) or in 20 mM His (pH 6.5; orange) showing a 3.9°C Tm shift. (F) Particle size distribution analysis via MADLS of ACE2(HH:NN)-Fc (LALA-PG) at 1 mg/ml in PBS (pH 7.4; blue) and 20 mM His (pH 6.5; orange) showing comparable profile (mean ± SD).