
Figure 3. Dhps deletion diminishes adoption of an M1-like proteomic signature.
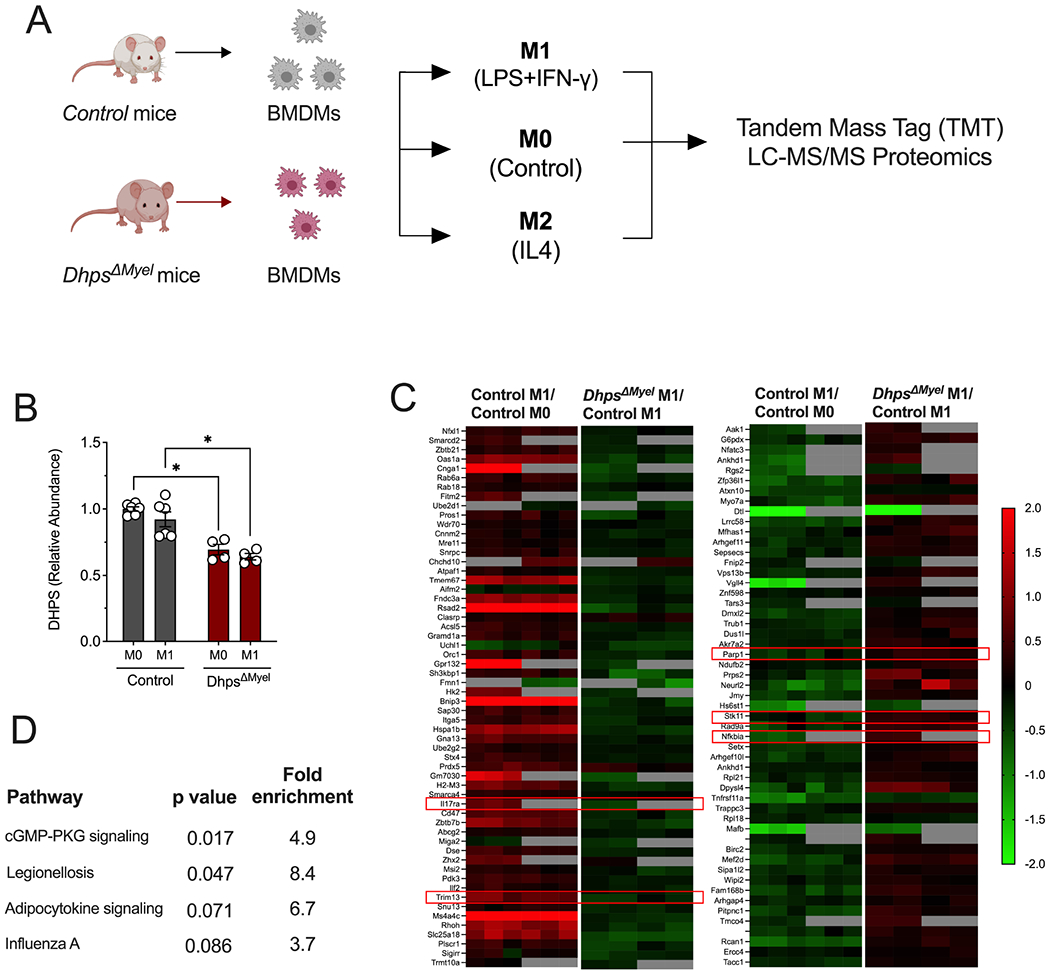
Bone marrow-derived macrophages (BMDMs) from control (combination of DhpsLoxp/Loxp and DhpsLoxp/+) mice (n=6) and DhpsΔMyel mice (n=4) were unpolarized (M0) or M1-polarized with LPS + IFN-γ, and multiplex tandem mass tag (TMT) LC-MS/MS-based proteomics analysis was performed. (A) Schematic of experimental design; (B) Quantification of DHPS levels from proteomics; (C) Heatmaps of significantly differentially regulated proteins (identified by their coding genes) in control cells upon M1 polarization, and those that are differentially regulated in DhpsΔMyel macrophages upon M1 polarization. Red boxes highlight key inflammatory molecules discussed in the text; (D) KEGG Pathway Analysis of proteins differentially regulated in DhpsΔMyel macrophages upon M1 polarization. *p<0.05 by ANOVA. Data are presented as mean ± SEM.