

Abstract
Background:
Development of the vertebrate intestinal epithelial stem cell niche begins during embryogenesis but maturation occurs postembryonic. The intestinal mammalian crypt contains stem cells interspersed by secretory cells that play a role in regulation of proliferation. Epithelial cells are specified as either secretory or enterocytes as they migrate up the villi in mammals or fold in zebrafish. Zebrafish forms a functional intestine by the end of embryogenesis but takes another 4 weeks to develop the adult proliferation pattern.
Results:
We characterize development of the intestinal epithelial stem cell niche during the postembryonic period. During the first 2-weeks postembryogenesis, different groups of epithelial cells sequentially proceed through one or two cell cycles, appear to become quiescent, and remain at the interfold base. The third week begins asymmetric divisions with proliferative progeny moving up the folds. Apoptotic cells are not observed at the fold tip until the end of the fourth week. Secretory cells intersperse among interfold base proliferative cells, increasing in number during the third and fourth weeks with a coincident change in proliferation pattern.
Conclusions:
Zebrafish postembryonic intestinal epithelial development consists of 2 weeks of slow proliferation followed by 2 weeks of metamorphosis to the adult structure.
Keywords: secretory cell, zebrafish, development, intestine, epithelial, proliferation, post-embryonic
Introduction
The organization of the adult zebrafish intestinal epithelium is similar to other vertebrates in that there is a group of epithelial cells in S phase (stem cell compartment) at the fold base which produce progeny that migrate up the fold and undergo apoptosis at the tip (Crosnier et al., 2005; Wallace et al., 2005). During development of the zebrafish intestine, the epithelium must develop functionality at the end of embryogenesis before maturation into the adult form due to consumption of the yolk supply. At the end of embryogenesis, the zebrafish intestine is able to incorporate nutrients and provide a barrier to the external environment even though it has not matured to the adult pattern of proliferation and replacement of the epithelial cells.
Maturation of stem cell compartments in the interfold regions occurs over 4 weeks postembryogenesis. Even though the intestinal epithelium develops folds and proliferation becomes restricted to the fold base by the end of embryogenesis (Wallace et al., 2005), progeny of proliferating cells do not migrate up the folds and apoptosis does not occur at the fold tips until the end of 4 weeks postembryogenesis (Crosnier et al., 2005). During this 4-week postembryonic period, there are only broad outlines of how the zebrafish stem cell compartment maturation occurs (Crosnier et al., 2005; Haramis et al., 2006; Muncan et al., 2007; Faro et al., 2009).
During mouse intestinal development, proliferation is restricted to the intervillus space toward the end of embryogenesis but maturation of the stem cell compartments occurs postnatally with formation of crypts (reviewed in Spence et al., 2011). The intervillous region begins crypt development 5 days after birth, with several different size crypts (Itzkovitz et al., 2012). The number of Lgr5 + stem cells in the crypt appear to play a role in transition between symmetric and asymmetric divisions which produce nonstem cell progeny that migrate up the villi (Itzkovitz et al., 2012). As crypts mature, they become clonal with all achieving this state between P14 and P15 (Schmidt et al., 1988; Yanai et al., 2017). However, asymmetric stem cell divisions begin before crypts become clonal, as progeny of stem cells begin migrating up the villi at 7 days after birth (Schmidt et al., 1988; Yanai et al., 2017). Both Paneth cells in the small intestine and goblet cells in the large intestine interdigitate between stem cells following transition between symmetric and asymmetric division (Itzkovitz et al., 2012). Following maturation of the crypts, the intestine grows significantly over the next 2 weeks both in length and circumference by significant increases in crypt number and depth (Tan et al., 2013; Langlands et al., 2016).
Recent work with the chicken and mouse intestines demonstrate that formation of functional circular and longitudinal smooth muscle toward the end of embryogenesis results in the production of intestinal epithelial folds (Shyer et al., 2013) and subsequently promotes restriction of proliferative compartments to the base of the developing folds and villi (Shyer et al., 2015). Before smooth muscle development, there is proliferation throughout the entire intestinal epithelium.
Formation of smooth muscle in the zebrafish intestine may also promote folding and restricted proliferation similar to chicken and mouse but at an earlier period in embryogenesis. Similar to chicken and mouse, there is proliferation throughout the entire zebrafish intestinal epithelium before smooth muscle development (Wallace et al., 2005). After development of both circular and longitudinal smooth muscle by 4 days postfertilization (dpf), the zebrafish intestinal epithelium begins folding, which is followed by a gradual restriction of proliferation to the fold base by the end of embryogenesis (Wallace and Pack, 2003; Wallace et al., 2005; Olden et al., 2008). Earlier smooth muscle development (as compared to mouse and chicken development) is necessary to develop a functional intestine by the end of embryogenesis. As a result of the need for zebrafish to create an early functional intestine, events such as smooth muscle development and subsequent restriction of epithelial proliferation to the interfold base occurs earlier than in mouse and chicken.
Here, we identify two periods of zebrafish intestinal stem cell compartment maturation during the postembryonic period using patterns of epithelial proliferation and structure of the developing fold base. The first period involves proliferation restricted to the epithelial interfold base and encompasses the first 2 weeks postembryogenesis (6 to 19 dpf). During the second 2-week period (20 to 33 dpf), the intestine undergoes metamorphosis with looping of the intestine, deepening of epithelial folds, and progeny of epithelial proliferation moving up the folds culminating in maturation of the intestinal epithelium into the adult structure. Both of these periods have different numbers of secretory cells interspersed between proliferating cells at the interfold base.
Results
Intestinal Growth and Fold Maturation During the Postembryonic Period
While zebrafish larvae develop a functional intestine by the fifth day of embryogenesis, there is additional growth and maturation that occurs during the next 4 weeks (6 to 33 dpf), resulting in an intestine with an adult proliferation pattern (Crosnier et al., 2005). We first quantified changes to both length and width of the whole paraformaldehyde fixed intestine to identify patterns of growth in the postembryonic intestine. While the adult intestine has a loop that folds back on itself to create an S shape (Wallace et al., 2005), for the first 2 weeks postembryogenesis (6 to 19 dpf), the intestine does not develop additional bending (Fig. 1A). The intestine grows in length between 6 and 19 dpf but does so slowly with an average increase of 700 microns between 5 and 19 dpf (Fig. 2A). The width in the anterior doubles (Fig. 2B) and nearly triples in the posterior (Fig. 2C). While the intestine is growing during 5 to 19 dpf, growth is slow and the majority of the expansion occurs with increased diameter. Modest changes in dimensions of the intestine between 6 and 19 dpf suggest a lower rate of proliferation.
Fig. 1.

Growth of postembryonic larval intestine. The larval intestine continues as a straight tube for the 2 weeks following embryogenesis (A). The main change in appearance of the intestine between 6 and 19 dpf is doubling or tripling of the intestinal diameter. During the third week (20 to 26 dpf), a loop develops by first bending the intestine laterally and then rotating the bend dorsally (B). The loop continues to grow anteriorly and appears to draw in a portion of the posterior intestine into the loop (C). The intestine continues to grow in length during the fourth week (27 to 33 dpf) but not at the same rate as in the third week. One of the changes is a narrowing of the anterior intestinal diameter (D). Scale bar =100 μm
Fig. 2.
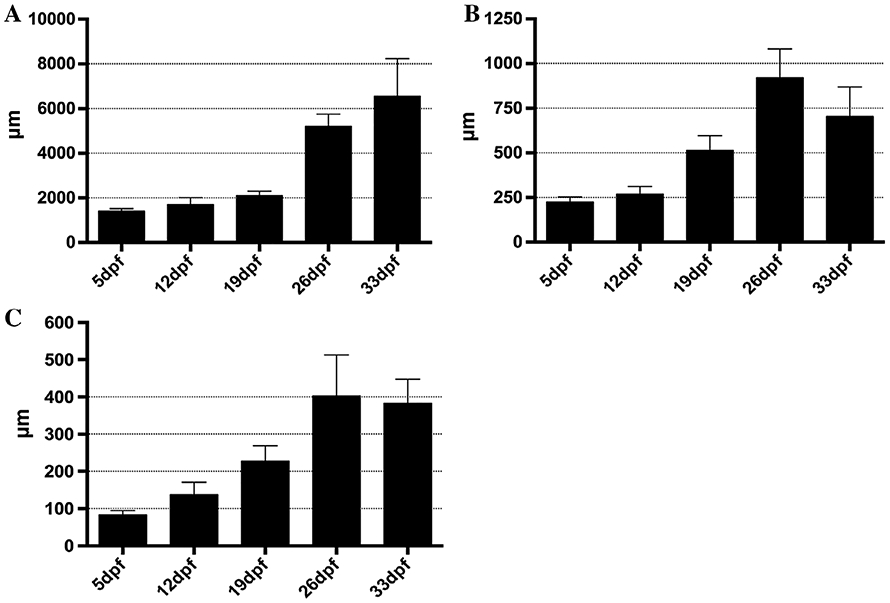
Changes in intestine dimensions of the postembryonic larval intestine. Quantification of increases in length (A) and diameter (B, anterior; C, posterior) intestine between 6 and 33 dpf. While there are increases in all intestine dimensions during the first 2 weeks postembryogenesis (6 to 19 dpf), changes become more pronounced by the end of the third week (26 dpf). 5 dpf n = 13; 12 dpf n = 9; 19 dpf n = 16; 26 dpf n = 11; 33 dpf n = 11.
During the third week postembryogenesis (20 to 26 dpf) there are dramatic changes in the length and width of the intestine. Between 20 and 22 dpf, a loop begins to develop midway through the intestine (Fig. 1B), which continues growing anterior to create an S shape (Fig. 1C) which more than doubles the length of the intestine by 26 dpf (Fig. 2A). Looping of the intestine back on itself produces a longer tract while being able to fit into a similar anterior to posterior length of the earlier straight intestine. As the loop continues to grow anteriorly between 22 and 26 dpf, the posterior intestine appears to be drawn into the loop until there is just a short stretch protruding past the looped area by 26 dpf (Fig. 1C).
Between 27 and 33 dpf the intestine continues to grow in length, increasing by over 1,000 μm but the change is not as dramatic as the doubling in length between 19 and 26 dpf (Fig. 2A). By 33 dpf, the trend is for the diameter of the intestine to become narrower than 26 dpf in both the anterior and posterior (Fig. 2B,C). As the intestine completes larval growth, the increased length may provide enough of an increase in digestive capacity so as to no longer need an enlarged anterior intestine as a food reserve.
Increased length and changes in proliferation pattern also change the appearance of the intestinal epithelial folds between 19 and 26 dpf (Fig. 3). Epithelial folds begin developing by 74 hpf during embryogenesis (Wallace et al., 2005). By 19 dpf, epithelial folds viewed from the lumen side appear shallow (Fig. 3A) but similar in shape to 26 dpf (Fig. 3B). A week later at 26 dpf, folds are more defined and deeper (Fig. 3B). Changes in fold depth can also be observed in cross section of the anterior region of 19 (3C) and 26 (3D) dpf intestine.
Fig. 3.

Intestinal fold appearance. Intestinal folds viewed from the lumen side are defined at 19 dpf but appear shallow (A). Folds appear deeper by 26 dpf (B). Histological sections of 19 dpf folds (C) appear less developed than folds of 26 dpf intestines (D). Images from the lumen side and the histological images are from the anterior most portion of the mid region of the intestine as diagramed in the green lateral view of 19 dpf (E) and ventral view of 26 dpf (G); anterior is to the left). Cartoons in E to H also diagram regions recorded in Table 1. Anterior, pink; green, mid; red, posterior (E,G). The 19 dpf (F) and 26 dpf (H) diagram regions of folds recorded: black line represents the fold and dots represent nuclei. Green to green nuclei is width of base; green to blue (at tip of fold- top of diagram) is height of fold. Scale bar = 200 μm in A,B; 20 μm in C,D. Red line base of mesenchyme/limit of intestine; asterisk, lumen in C and D.
Fold appearance at 26 dpf is similar to adult structure. To quantify changes to the folds between 19 and 26 dpf, the number of epithelial cells in the interfold base as well as the fold height were counted. There are statistically significant differences in each region of the intestinal epithelium when comparing 19 dpf with 26 dpf. While standard deviation is high when comparing 19 with 26 dpf, all values have a significant difference using the Student t-test. Increased growth and depth of folds as well as intestinal looping during the third week suggests increases in proliferation rate and changes in the fate of mitotic progeny.
Intestinal Proliferation During Immature Stage (6 to 19 dpf)
During the first 2 weeks of the postembryonic period, the intestine is functional but the epithelium has not yet acquired features of the adult intestine such as stem cell progeny moving up the folds with apoptosis at the fold tip. As shown above, the intestine does not grow as much in length but the diameter doubles in the anterior and nearly triples in the posterior during this period. Here, we characterize the epithelial proliferation pattern during the 6 to 19 dpf period with 5-ethynyl-2′-deoxyuridine (Edu) incorporation using both a short pulse (injection of Edu and growth for 1 hr to allow incorporation) and a chase to determine the length of the cell cycle and the location of mitotic progeny following division. Edu injection at different days during the 6 to 19 dpf period labels mostly isolated cells throughout the epithelium (Fig. 4A). The number of epithelial cells labeled with each of the pulses changes during the first 2 weeks postembryogenesis. The number of labeled S phase cells during the first (6 to 12 dpf) and second (13 to 19 dpf) week appears to change in the same manner with a moderate level of epithelial cells in S phase at the beginning of the week, dropping mid-week followed by an increase to numbers higher than the beginning of the respective week (Fig. 4C,D).
Fig. 4.

Intestinal epithelial proliferation 6 to 19 dpf. During the 6 to 19 dpf period an hour pulse of Edu labels a similar distribution of isolated cells throughout the intestinal epithelium. A: Example of 1-hr Edu pulse in anterior of 6 dpf intestine dissected, mounted and imaged following a pulse of Edu (anterior to the left and dorsal is to the top). Edu-labeled cells are imaged in two regions as diagramed in B (anterior to right); one region (183 × 183 μm) in the anterior as the intestine begins to enlarge in diameter (blue box labeled A) and another in the posterior (blue box labeled P), 183 μm from the posterior end (indicated by red line). Quantification of Edu pulse labeling in the anterior (6 to 12 dpf, C; 13 to 19 dpf, D; black bars) and posterior (6 to 12 dpf, B; 13 to 19 dpf, C; gray bars) demonstrates a repeating pattern of proliferation with moderate levels at the beginning of the week (B, 6 dpf; C, 13 dpf) followed by reduction (B, 8 dpf; C, 15 dpf) with an increase at the end of the week (B, 10 dpf; C, 17 dpf). During both the first (B) (6 to 12 dpf) and second week (C) (13 to 19 dpf) there is significant changes in the proliferation rate when comparing the first day to both subsequent days during the week as analyzed using the Student t-test with Bonferroni correction (*P < 0.025; **P < 0.005; ***P < 0.0005). n = 20 per dpf; Scale bar = 20 μm.
To estimate the length of the cell cycle, both the number of cells labeled with an Edu injection with an hour growth (referred to as a pulse) as well as a subsequent chase period was assessed. Cells labeled in S phase should continue into mitosis and double in number during the chase, indicating a completed cell cycle. Numbers of Edu-labeled cells were compared between the pulse and chase for both the first week (6 to 12 dpf) and the second week (13 to 19 dpf). Several chase times were investigated to determine the time frame for doubling in both weeks (Fig. 5A,D). During the first week postembryogenesis, epithelial doubling occurs after 12 hr (Fig. 5B,C) while this time increases to 24 hr during the second week (Fig. 5E,F).
Fig. 5.

Estimation of cell cycle length during the first and second week postembryonic period. Edu is injected at the beginning of the respective week (A, 6 dpf or D, 13 dpf). Average Edu-labeled cells were quantified after a pulse (1 in A and D) and varying chase periods (A2, 7.5 hr; A3, 12 hr; A4, 6 days; D2, 12 hr; D3, 24 hr; D4, 48 hr; D5, 6 days). Anterior and posterior regions are the same position and size as in Figure 4. During the first week, both in the anterior (B) and posterior (C) labeled cells double by 12 hr. The doubling time during the second week increases to 24 hr in both the anterior (E) and posterior (F). During both weeks, a chase period of six days demonstrates that labeled cells do not continue doubling each 12 or 24 hr during the rest of the week. n = 30 per week in three independent experiments. Averages: 6–12 dpf anterior- pulse (6 dpf) 1 hr-38.5; 7.5 hr- 73; 12 hr- 79.5; 12 dpf (6 days postinjection)- 126.7 posterior- pulse (6 dpf) 1 hr- 41.3; 7.5 hr- 60.2; 12 hr- 84.2; 12 dpf (6 days postinjection)- 123.5; 13-19 dpf anterior- pulse (13 dpf) 1 hr- 43.7; 12 hr- 64.4; 24 hr- 96.8; 48 hr- 117.7; 19 dpf (6 days postinjection)- 127.5 posterior- pulse (13 dpf) 1 hr- 55.8; 12 hr- 68.4; 48 hr- 115.3; 19 dpf (6 days postinjection)- 118.7.
Epithelial cells continue dividing following the initial doubling period, however, they do not double again during the remainder of the week (Fig. 5). Increases in epithelial cells following a 6-day chase are even less by the end of the second week when compared with the end of the first week postembryogenesis (Fig. 5). As the number of cells continue to increase after doubling (Fig. 5), there must be a group of epithelial cells that continues through more than one round of the cell cycle. However, the Edu chase numbers suggest that after an initial round of the cell cycle, most of the epithelial cells slow (some may proceed through another division or more) or become quiescent.
Epithelial cells labeled in these chase experiments do not account for all of the proliferation that is observed in Edu pulses on individual days during the first 2 weeks postembryogenesis (Fig. 4C,D). The epithelial cells labeled during each pulse (Fig. 4C.D) should undergo mitosis and double within either 12 or 24 hr depending on the week. From the three separate days of Edu pulses (Fig. 4C,D), doubling would generate around 300 labeled cells. Presumably, pulse labeling on all days during the week would produce a higher total of labeled cells as we performed Edu pulses for only 3 of the 7 days of the week. The difference in numbers of labeled cells between the pulse experiment (Fig. 4C,D) and the chase (Fig. 5) would suggest that rather than the same initial Edu-labeled cells continuing in the cell cycle to continue producing all the progeny and growth during the first 2 weeks postembryogenesis, additional epithelial cells must be recruited to enter the cell cycle later during the week. Therefore, individual fold base epithelial cells are likely to take turns entering the cell cycle, creating groups of cells proceeding through one or two cell cycles, becoming quiescent followed by other group of cells entering the cell cycle between 6 and 19 dpf.
If most groups of epithelial cells proceed through the cell cycle only once during the 2 weeks postembryogenesis, then labeling S phase cells on different days should show minimal overlap. To distinguish labelings on different days, cells were injected first with Edu then a 5-Bromo-2′-deoxyuridine (Brdu) injection (followed by an hour to allow nucleotide incorporation) 2 days later. During these 2 weeks, epithelial cells are labeled at 6 or 13 dpf, grown to 9 or 16 dpf and labeled with Brdu (6A,D). When imaged, few cells co-label with most only labeled with either Edu or Brdu (Fig. 6B, 6–9 dpf; Fig. 6E, 13 to 16 dpf). Cells with both labels range from 1 to 4 % (Fig. 6C, 6–9 dpf; Fig. 6F, 13 to 16 dpf) lending further support to the idea that the most of the same fold base epithelial cells do not continuously reenter the cell cycle during this period.
Fig. 6.

Overlap between S phase cells labeled on different days between 6 and 19 dpf. Cells are labeled with Edu (green) on 6 (A) or 13 (D) dpf followed by Brdu (red) labeling on 9 (A) or 16 (D) and fixed 1 hr after Brdu injection (blue arrow A and D). Both during the first (B) and the second (E) week postembryogenesis there is little overlap between the two groups. Only one cell in each field of view co-labels with Edu (green) and Brdu (red) (white arrows). Quantification of Edu and Brdu-labeled cells and overlap between the two labeled cells during the first week (B) and the second week (D). C,F: Anterior and posterior regions are the same position and size as in Figure 4. Control single labelings of Edu or Brdu were processed for detection of the opposite nucleotide (injected at 4 dpf and grown to 5 dpf). While the injected nucleotide was detected, there was no cross-reactivity for the opposite nucleotide demonstrating the specificity of Edu and Brdu detection. n = 10 per week; Scale bar = 10 μm.
During all of the labeling between 6 and 19 dpf, epithelial cells in S phase are restricted to the interfold base (Fig. 7). Histological cross section of intestines labeled with a pulse of Edu or chase at any time during the 2-week period results in epithelial cells only being found at the interfold base (Fig. 7A,D). Epithelial cells labeled at the beginning of the first week (Fig. 7B) or the beginning of the second week (Fig. 7E) and followed to the end of the second week can only be found at the interfold base (Fig. 7C,F). With proliferation only at the interfold base and progeny remaining at the base, this suggests that the folds do not grow in height and intestinal growth occurs primarily by expansion of the interfold base between 6 and 19 dpf.
Fig. 7.

Position of proliferating cells between 6 and 19 dpf. Epithelial cells are labeled with a pulse of Edu (1 hr) at 7 dpf (A, blue arrow) and 14 dpf (D, blue arrow) followed by a chase to 19 dpf (red arrow). All labeled cells start in the interfold base (B, 7dpf and E, 14 dpf) and remain at this position following the chase period (C, 7 to 19 dpf and F, 14 to 19 dpf). Arrows indicate Edu-labeled cells (B, C, E, and F); Scale bar = 10 μm; n = 5.
Intestinal Epithelial Proliferation During Maturation to the Adult Form (20 to 33 dpf)
During the third and fourth weeks postembryogenesis (20 to 33 dpf) metamorphosis from the larval to the juvenile form begins. During the third week, the intestine develops a loop, the folds become more pronounced, and the intestine doubles in length between 19 and 26 dpf, suggesting that the proliferation rate increases during this period. During the third week (20 to 26 dpf) small groups of evenly distributed cells at the interfold base are labeled with a pulse of Edu (injected with Edu and allowed to incorporate for 1 hr) throughout the intestine. The number of cells labeled, however, continues to vary during the third week in both the anterior and posterior but increases during the latter half of the week (Fig. 8A,C). The looped region has the most growth between 22 and 26 dpf and has a significantly higher proliferation rate than the intestine before and after the loop with increased numbers at both 24 and 26 dpf (Fig. 8C).
Fig. 8.

Proliferation through the third week (20 to 26 dpf). Proliferation levels during the third week are similar to the first 2 weeks postembryogenesis (A). Anterior and posterior regions are the same position and size as in Figure 4. As the intestinal loop develops, a segment within the loop was sampled (B). A segment just before the loop (A-BL), in the loop (BL-L), and after the loop (L-AL). AL (B) region begins 183 μm from the posterior end. Each region is 183 × 183 μm. In the segment anterior and posterior to the loop, more cells enter S phase in the latter half of the week first in the region posterior to the loop (24 C) then both anterior and posterior to the loop at 26 hpf (C). The looped region is where most of the new length is added and the loop region has significantly higher proliferation rates (C) Significance in (C) measured by Student t-test *P < 0.05, ***P < 0.001. n = 10 per time point.
In contrast to the first and second weeks postembryogenesis, proliferating cells are no longer primarily within the epithelium. To determine whether proliferating cells are in the epithelium or mesenchyme, histological sections of five individuals, pulsed with Edu for 1 hr at 26 and 33 dpf were assessed. Within sections, S phase cells were counted as either epithelial or mesenchymal cells based on position within the histological section (Fig. 9I,J). Counts were started either 100 μm from the anterior or posterior end of the intestine. After the 100 μm, 5-μm sections were scored for a stretch of 50 μm. Every other section was skipped to avoid counting parts of the same cell in the neighboring section. During both 26 and 33 dpf, there is approximately equal distribution of S phase cells between the epithelium and mesenchyme in both anterior and posterior (Table 2). Increased numbers of proliferating cells in the mesenchyme is coincident with increased depth of folds, which is observable by the end of the third week (Fig. 3B,D).
Fig. 9.

A–J: Epithelial cells migrate up the folds during the third and the fourth week postembryogenesis. Individuals are injected with Edu (green arrow) either at 20 (A) or 27 (E) dpf. Samples are taken at 1 hr to determine initial cell position (first blue arrow, A and E) and then at 2-day intervals to the end of the week (three additional blue arrows, A and E). With a pulse of Edu at either 20 dpf (A) or 27 dpf (D) epithelial cells are labeled only at the fold base (arrows). Following a chase for 2 days to either 22 (C) or 29 (G) dpf, progeny reach the mid-fold (arrows) and reach the tip by 4 days at either24 (B) or 31 (E) dpf. In each of the histological panels, the dashed line is drawn between the epithelial and mesenchymal layers. During these 2 weeks, mesenchymal cells are also labeled (examples at 24 dpf-C and 31-F; mesenchymal cells indicated with arrowheads); n = 4.
TABLE 2.
Distribution of S Phase Cells Between Epithelium and Mesenchyme During the Third and Fourth Weeks
| 26 dpf Cells | Percentage | 33 dpf Cells | Percentage | |
|---|---|---|---|---|
| A Epithelial | 122 | 49.2 | 273 | 48.4 |
| A Mesenchyme | 126 | 50.8 | 291 | 51.6 |
| P Epithelial | 102 | 48.3 | 272 | 49.7 |
| P Mesenchyme | 109 | 51.7 | 275 | 50.3 |
Following an Edu pulse, the number of epithelial versus mesenchymal cells in S phase were evaluated in anterior (A) and posterior (P) intestinal cross sections. Both the total number of cells and the percentage that they represent are listed for 26 and 33 dpf.
During the third week, the proliferation pattern changes with progeny of cells migrating up the folds rather than remaining at the interfold base as during 6 to 19 dpf. A pulse of Edu either during the third week (Fig. 9A) or the fourth week (Fig. 9D) labels cells only at the interfold base. An Edu pulse at 20 or 27 dpf followed by a chase to either 24 (Fig. 9B) or 31 (Fig. 9E) dpf produces Edu-labeled cells that reach the tip of the folds. Shorter chase periods produce epithelial cells that migrate to intermediate positions on the fold (Fig. 9C,G). Migration of adult intestine epithelial stem cell progeny to the tip of the fold occurs within 7 days (Wallace et al., 2005). A shorter migration to the tip of the folds of 4 days during the last 2 weeks of the larval period may be required for growth of the folds especially during the third week (20 to 26 dpf), which continues into the fourth week (27 to 33 dpf). Also epithelial cells migrating up the folds may contribute primarily to lengthening of the folds during the larval period rather than participating in turn over as with the adult intestine.
Migration of epithelial stem cell progeny up the developing folds is one aspect of a mature intestinal epithelium. Another indicator of epithelial maturation is the initiation of apoptosis at the fold tip. To determine when apoptosis begins at the fold tip, we used the transgenic line Tg(βactin:SecAV-YFP)pu17 which produces a constitutively secreted AnnexinV tagged with YFP (Hsu et al., 2018). As cells begin apoptosis, phosphatidylserine (PS) flips to the outer leaflet of the lipid membrane which preferentially binds to the anticoagulant AnnexinV (Fadeel and Xue, 2009). Tg(βactin:SecAV-YFP)pu17 transgenics constitutively produce tagged AnnexinV which binds to PS of cells entering early stages of apoptosis allowing fluorescent detection.
Apoptosis was not detected at the fold tip during the third week postembryogenesis (20 to 26 dpf) but a few intermittent cells do appear to undergo apoptosis at the fold tip by the end of the fourth week at 33 dpf (Fig. 10D-F). This suggests that migration of the progeny of epithelial stem cells up the fold during the third and fourth weeks are primarily participating in lengthening the folds rather than turning over epithelial cells. Later at 2 months, multiple AnnexinV-labeled cells begin to appear at the fold tips (Fig. 10G-I) suggesting a more prominent turnover of differentiated cells up the folds as the intestinal epithelium continues to mature.
Fig. 10.

A–I: Development of apoptotic cells. In cross sections of the Tg(βactin:SecAV-YFP)pu17 line, no apoptotic cells are observed during the third postembryonic week (example 23 dpf A to C). A small numbers of apoptotic cells are first observed at the tip of the fold at 33 dpf (arrow in E and merge with DAPI nuclear stain in F). Apoptotic cells become more prominent at the fold tip by 2 months postembryogenesis (arrows in H and merge with DAPI nuclear stain in I).
Development of Interdigitating Secretory Cells at the Interfold Base
In mammals, secretory cells play a key role in regulation of the adult stem cell niche. In the small intestine of mammals, Paneth cells interdigitate between the crypt base columnar cells (CBCs) and in combination with mesenchyme signals, regulate growth of these stem cells (Bjerknes and Cheng, 1999; Stange and Clevers, 2013; Barker, 2014). In the large intestine, a specialized group of goblet cells play a similar role with interdigitation between crypt stem cells (Rothenberg et al., 2012). With the important role of secretory cells in stem cell regulation in mammalian crypts, zebrafish intestinal epithelial stem cell niches may also develop interdigitating secretory cells that play a role in stem cell regulation.
To determine whether secretory cells develop within the interfold base, we used the pan-secretory cell marker, 2F11 (Crosnier et al., 2005). Edu was injected to determine the relationship between developing proliferative compartments at the interfold base and secretory cells. During the embryonic period (4 to 5 dpf) when epithelial proliferation is becoming restricted to the interfold base, Edu injection at 4 dpf followed by a chase of 24 hpf labels many loosely arranged clustered epithelial cells (Fig. 11A). Some of the Edu-labeled cells do not form clusters (Fig. 11A) suggesting that there may be differences in the number cells in the cell cycle and/or times mitotic cells enter the cell cycle. Edu-labeled progeny may also move away from clusters as other unlabeled cells move them away from the cluster. When combined with 2F11, Edu-labeled clusters contain anywhere from two to four secretory cells distributed throughout the clusters (Fig. 11A). When the proliferating cells are observed in histological cross section, secretory cells are associated with S phase cells at the fold base (Fig. 11B).
Fig. 11.

Secretory cells associate with clusters of proliferating intestinal epithelial cells. A pulse of Edu at 96 hpf followed by a chase to 120 hpf labels a group of proliferating cells (A) which is present at the fold base (B). Secretory cells (anti-2F11) are interspersed within proliferating epithelial cells. Labeling with Edu on three different days during the first week postembryogenesis (C) (6–12 dpf) or the second week postembryogenesis (E) (13–19 dpf) labels clusters of proliferating epithelial cells. Secretory cells develop within groups of proliferating cells at the fold base (D) (6–12 dpf) and (F) (13–19 dpf) in a similar manner and number as observed at the end of embryogenesis. Some fold base epithelial cells begin differentiating into secretory cells (arrowhead A, C, E, and F) as they co-label with 2F11 and Edu. Pan-secretory 2F11, red; Edu, green; DAPI, blue; asterisk, intestinal lumen. Anterior is to the left and dorsal to the top in A, C, and E. Scale bar = 10 μm.
As single pulses of Edu between 6 and 19 dpf labels only isolated cells at the fold base, multiple labelings on different days should produce clusters of fold interfold base cells. During the first 2 weeks (6 to 19 dpf) postembryogenesis, Edu incorporation on three different days during each week (labeled on 6, 8, and 10 dpf for the first week and 13, 15, and 17 dpf for the second week postembryogenesis) produces loosely grouped clusters of labeled epithelial cells at the interfold base. As with the end of embryogenesis, some Edu-labeled cells are not in clusters (Fig. 11C,E). During the first and second postembryonic weeks, fold base epithelial cells enter the cell cycle at different times during the week (Fig. 4). As a result, we suggest that if these individuals are labeled with Edu each day of the week, most fold base cells would be labeled (summarized in Figure 13). Similar to the 4- to 5-day period of embryogenesis, there are approximately two to four secretory cells distributed within groups of labeled epithelial cells at the interfold base (Fig. 11C, 12 dpf; Fig. 11E, 19 dpf). Secretory cells are likely to differentiate from the field of proliferating cells and we do see several secretory cells colocalized with Edu, suggesting that these cells differentiated after completing the cell cycle. More secretory cells are co-labeled with Edu in the 19 dpf sample suggesting that there may be several secretory cells differentiating to provide the increased numbers of secretory cells observed during the third week postembryogenesis (Fig. 12A). If most of the fold base epithelial cells are competent to enter the cell cycle, secretory cells are likely to be fairly evenly distributed along the fold base among these proliferative cells. In histological cross section, secretory cells are found within groups of S phase cells at the fold base (Fig. 11D, 12 dpf; Fig. 11F, 19 dpf).
Fig. 13.

Model of postembryonic intestinal epithelial development. A: Pulse labeling reveals a small group of mostly isolated fold base epithelial cells entering the cell cycle on a given day and most become quiescent after one or two rounds (bar indicates base region in A- represented by individual color nuclei). S-phase labeling on multiple days during the first 2 weeks postembryonic period produces clusters of fold base epithelial cells (each color nuclei at fold base represents group of cells in S phase on a given day), revealing that most fold base epithelial cells have mitotic potential. Mitotic progeny remain at the fold base during this period suggesting that the intestine grows by expansion of fold base length and width. During the third week (B), pulse labeling also produces mostly isolated cells represented by multiple color nuclei at fold base. However, now mitotic progeny begin moving up the folds (red, orange, or yellow nuclei on folds- direction of movement indicated by arrows). Also half of the observed mitotic activity is now in mesenchyme in addition to epithelium (light green nuclei in mesenchyme). Apoptotic activity is not observed at the fold tips. Movement of epithelial progeny up the folds and mesenchymal mitosis accounts for significant changes in fold height during the third postembryonic week. The intestine almost doubles in length during the third week partially by looping. The loop increases intestinal length with a higher rate of mitotic activity than anterior and posterior regions. During the fourth week (C), multiple fold base epithelial cells are in mitosis at the same time (nuclei in same color at fold base), progeny continue to migrate up the folds (red nuclei on folds) and half of the observed mitotic activity is in mesenchyme cells (light green nuclei in mesenchyme). In contrast to the third week, apoptotic cells are now occasionally observed at the fold tip (white nuclei at fold tips) suggesting that the folds are still growing in height but intestine is also taking on the mature form during the fourth week postembryogenesis. Secretory cells distributed between proliferating cells become more numerous during the third and fourth week postembryogenesis. Secretory cells are likely to play roles in development of the stem cell compartment as well as regulation of proliferation.
Fig. 12.

Secretory cells interdigitate between proliferating epithelial cells between 20 and 33 dpf. Labeling with Edu on three different days during the third week postembryogenesis labels multiple cells at the interfold base (A). Secretory cells now interdigitate between many of the proliferating epithelial cells. At 33 dpf, a single pulse of Edu labels multiple cells at the interfold base (B). Similar to 26 dpf, the interfold base now has many secretory cells and proliferating epithelial cells interdigitated. Numerous interdigitating secretory cells are observed between proliferating epithelial cells in the adult intestine following a single Edu pulse (C). The edge of the fold facing the lumen is outlined with the yellow dashed line. Red, pan-secretory 2F11; green, Edu; blue, DAPI; white dashed line outer edge of intestine, asterisk, intestinal lumen. Scale bar = 10 μm.
By the end of the third week postembryogenesis (26 dpf), there is an increase in secretory cells at the interfold base, which interdigitate between proliferating stem cells. Edu injection three times during the week beginning at 20 dpf (injected 20, 22, 24 dpf) labels numerous interfold base epithelial cells. Cross-sections of individuals with Edu and anti-2F11 immunohistochemistry demonstrate that increased numbers of secretory cells interdigitate between Edu-labeled cells (Fig. 12A). Less secretory cells co-labeled with Edu during this period. We suggest that additional secretory cells differentiate toward the end of the second week postembryogenesis to create the increased secretory cell numbers.
During the end of the fourth week, a single injection of Edu now labels multiple S phase cells at the interfold base and anti-2F11 immunohistochemistry continues to label multiple interdigitating secretory cells (Fig. 12B). As this is a pulse label, most labeled cells are expected remain in S phase for the hour of incorporation following injection. Therefore, few Edu-labeled cells should co-label with 2F11 during this period. While the endpoint for the third and fourth week images looks similar, stem cells during the third week are not all in S phase at the same time while this the case during the fourth week. Histology following Edu and 2F11 reveals the mature adult interfold base with multiple proliferative epithelial cells and interdigitated secretory cells (Fig. 12C). The relationship between proliferating epithelial cells and secretory cells during the fourth week looks similar in the adult. Secretory cells at the interfold base begin with a more sporadic distribution at the end of embryonic development and into postembryonic stages, they become numerous within the adult interfold base, interdigitated between proliferating stem cells.
Discussion
Here, we characterize epithelial proliferation and secretory cell formation at the interfold base during the postembryonic period as the intestine develops into the adult structure. We begin to characterize proliferation and structure at the interfold base. During the first 2 weeks postembryogenesis (6 to 19 dpf), the intestinal epithelium experiences limited growth with proliferating cells restricted to the fold base. During the third week postembryogenesis (20 to 26 dpf), the intestinal epithelium grows more significantly in length and width as well as increasing the depth of the folds. Much of the growth in length produces a portion of the intestine that loops back on itself, taking a position next to the anterior segment. The segment that forms the loop has a higher proliferation rate than intestine before and after the loop.
During the first 2 weeks postembryogenesis (6 to 19 dpf), interfold base epithelial cells continue proliferating but the pattern promotes slow growth. After epithelial cells proceed through a few cell divisions, they appear to enter an extended nonproliferative period. Other cells at the fold base then enter S phase and proceed through a few cell divisions. All of the progeny of these epithelial cells remain at the interfold base, which also limits growth of the height of folds during this period. This pattern of proliferation suggests that a group of epithelial stem cells at the interfold base is present but growth is attenuated by limiting the number of stem cells in the cell cycle at a given time (Fig. 13).
As development of the intestine begins the third week, there are still mostly isolated cells labeling at the interfold base, however, stem cell progeny now begin migrating up the folds which is coincident with increased mesenchymal proliferation. Apoptosis has not begun at this point so we suggest that migration from the interfold base during this week is primarily to increase the length of the folds. As epithelial migration from the interfold base does not begin until the third week, this leaves a period of 14 days before new epithelial cells are produced within the active intestine (from 6 to 19 dpf). Interestingly, there is a similar period of time until new epithelial cells are produced in the postnatal mouse intestine. Once the postnatal period begins in the mouse intestine, there is a period of approximately 10 to 14 days before stem cell progeny begin to migrate up the villi suggesting this is the time limit before new differentiated epithelial cells need to be produced in an active intestine due to accumulated damage from a hostile environment (Al-Nafussi and Wright, 1982; Schmidt et al., 1988; Itzkovitz et al., 2012). A common time before new epithelial cells are produced in zebrafish and mouse also suggests a limit on the speed at which the stem cell compartment can be established. A mature intestinal stem cell compartment may not be able to be established in less than 2 weeks.
By the end of the fourth week postembryogenesis (27 to 33 dpf), proliferation at the interfold base changes with multiple epithelial cells in S phase, developing a pattern similar to the adult structure. Apoptosis of epithelial cells at the fold tip has begun at 33 dpf but not at high frequency suggesting that the adult pattern of epithelial turnover is just beginning at the end of the fourth postembryonic week and is coincident with transition from larval to juvenile phase (Fig. 13).
During each of these periods, secretory cells are also associated with proliferating epithelial stem cells. Between 4 and 19 dpf a few secretory cells associate with proliferating cells that cluster at the fold base. Numbers of secretory cells increase during the third week and become interdigitated between proliferating epithelial stem cells. Changes in number of secretory cell numbers at the interfold base is coincident with changes in the proliferation rate and pattern suggesting that there could be least two different types of secretory cells. The first group of secretory cells may play a role in limiting proliferation and restricting progeny to the interfold base during the first 2 weeks postembryogenesis. These secretory cells may also play a role in mediating symmetric divisions of stem cells within the developing interfold region. A second group of secretory cells may develop to promote changes in the proliferation pattern by promoting epithelial stem cell progeny to move up the fold. This would change stem cells to an asymmetric division pattern during the third and fourth weeks postembryogenesis. Similar to the regulatory roles of Paneth cells in the small intestine or goblet cells on CBCs in large intestine in mammals (Bjerknes and Cheng, 1999; Rothenberg et al., 2012; Stange and Clevers, 2013; Barker, 2014) zebrafish secretory cells in the third and fourth weeks postembryogenesis may also have regulatory roles in proliferation and maintenance of the stem cell compartment.
During the postembryonic period, the zebrafish intestine develops through a 2-week period of slow growth followed by a 2-week period in which the intestinal epithelium develops the adult form of proliferation and apoptosis. Growth of the interfold stem cell compartment during first 2 weeks may be primarily comprised of symmetric divisions, which could be replaced with mostly asymmetric divisions to create nonstem cell lineages during the second 2 weeks postembryogenesis. Additional experiments will be needed to determine the role of secretory cells in these processes.
Experimental Procedures
Fish Stocks
Fish maintenance and matings were performed as previously described (Westerfield, 1993). AB wild-type fish were used for most procedures (Westerfield, 1993). Tg(βactin:SecAV-YFP)pu17 were generously provided by the Deng lab (Hsu et al., 2018).
Immunohistochemistry
Embryos and postembryonic fish were fixed in 4% formaldehyde for 2 hr to overnight. Fixed individuals were then permeabilized with Proteinase K (Sigma) (stock concentration of 0.5 mg/ml typically diluted to working concentration of 10 μg/ml) in PBST for 20 min at room temperature. Intestines from individuals 20 to 33 dpf were dissected from the body before permeablization. Primary antibody was added and incubated at 4°C overnight. Individuals were then washed and incubated with secondary antibody (1:500) (Molecular Probes-Invitrogen) for 2 hr. Primary antibodies mouse 2F11 (1:50) (AbCam); chicken green fluorescent protein (1:1,000) (Aves Labs).
Edu and Brdu Nucleotide Incorporation and Detection
Embryos and larvae are micro-injected with a micro-capillary needle in the intestinal region (either directly into the intestine or peritoneal space) with either 10 mM 5-ethynyl-2′-deoxyuridine (Edu) or 50 mM 5-bromo-2′-deoxyuridine (Brdu). For pulse experiments, Edu or Brdu injected individuals were grown 15 to 60 min following injection to allow for nucleotide incorportation. For chase experiments, individuals were injected with either nucleotide and then grown to the described time. At end of the period, each group was fixed in 4% formaldehyde 2 hr to overnight. Incorporation of Edu was detected following the standard protocol for the 488 Click-it kit imaging kit (Invitrogen). For detection of Brdu individuals were exposed to 0.2 N HCl for 30 min at room temperature followed by anti-BrdU antibody (Sigma) incubation overnight at 4°C. Secondary antibody is Alexa Fluor 594-conjugated anti-mouse IgG (1:500) (Molecular Probes-Invitrogen).
Processing Samples for Imaging
Samples imaged in whole-mount were dissected using #5 Dumont Tweezers from the individual and intestines were mounted on a slide in Vectashield (Vector Laboratories).
Samples processed for histology by infiltration and embedded in glycol methacrylate (JB4 plus; Polysciences) or dimethysulf-oxide infiltrated paraffin (McCormick Scientific) for 4 hr at 60°C. Sections were cut on a Leica RM2135 microtome.
TABLE 1.
Quantification of Number of Cells Along the Height of the Fold and Within the Fold Base Demonstrates Significant Differences Between 19 and 26 dpf
| dpf | Position | Fold height | Fold base width |
|---|---|---|---|
| 19 | Anterior | 10.6 ± 2.9 | 19.9 ± 11.9 |
| Mid | 7.1 ± 2.6 | 18.4 ± 11.4 | |
| Posterior | 6.9 ± 2.2 | 36.7 ± 28.4 | |
| 26 | Anterior | 13.9 ± 4.1 | 12.6 ± 5.1 |
| Mid | 13.6 ± 3.6 | 11.8 ± 4.5 | |
| Posterior | 14.1 ± 7.5 | 15.2 ± 8.1 |
Acknowledgments
The authors thank the Deng lab for providing the Tg(βactin:SecAV-YFP)pu17 transgenic line. Research reported in this publication was supported by the Eunice Kennedy Shriver National Institute Of Child Health & Human Development of the National Institutes of Health under Award Number R15HD088202. The content is solely the responsibility of the authors and does not necessarily represent the official views of the National Institutes of Health.
Grant sponsor: Eunice Kennedy Shriver National Institute of Child Health and Human Development; Grant number: R15HD088202; Grant sponsor: Eunice Kennedy Shriver National Institute Of Child Health & Human Development of the National Institutes of Health; Grant number: R15HD088202
References
- Al-Nafussi AI, Wright NA. 1982. Cell kinetics in the mouse small intestine during immediate postnatal life. Virchows Arch B Cell Pathol Incl Mol Pathol 40:51–62. [DOI] [PubMed] [Google Scholar]
- Barker N 2014. Adult intestinal stem cells: critical drivers of epithelial homeostasis and regeneration. Nat Rev Mol Cell Biol 15:19–33. [DOI] [PubMed] [Google Scholar]
- Bjerknes M, Cheng H. 1999. Clonal analysis of mouse intestinal epithelial progenitors. Gastroenterology 116:7–14. [DOI] [PubMed] [Google Scholar]
- Crosnier C, Vargesson N, Gschmeissner S, Ariza-McNaughton L, Morrison A, Lewis J. 2005. Delta-Notch signalling controls commitment to a secretory fate in the zebrafish intestine. Development 132:1093–1104. [DOI] [PubMed] [Google Scholar]
- Fadeel B, Xue D. 2009. The ins and outs of phospholipid asymmetry in the plasma membrane: roles in health and disease. Crit Rev Biochem Mol Biol 44:264–277. [DOI] [PMC free article] [PubMed] [Google Scholar]
- Faro A, Boj SF, Clevers H. 2009. Fishing for intestinal cancer models: unraveling gastrointestinal homeostasis and tumorigenesis in zebrafish. Zebrafish 6:361–376. [DOI] [PubMed] [Google Scholar]
- Haramis AP, Hurlstone A, van der Velden Y, Begthel H, van den Born M, Offerhaus GJ, Clevers HC. 2006. Adenomatous polyposis coli-deficient zebrafish are susceptible to digestive tract neoplasia. EMBO Rep 7:444–449. [DOI] [PMC free article] [PubMed] [Google Scholar]
- Hsu AY, Gurol T, Sobreira TJP, Zhang S, Moore N, Cai C, Zhang ZY, Deng Q. 2018. Development and characterization of an endotoxemia model in Zebra fish. Front Immunol 9:607. [DOI] [PMC free article] [PubMed] [Google Scholar]
- Itzkovitz S, Blat IC, Jacks T, Clevers H, van Oudenaarden A. 2012. Optimality in the development of intestinal crypts. Cell 148:608–619. [DOI] [PMC free article] [PubMed] [Google Scholar]
- Langlands AJ, Almet AA, Appleton PL, Newton IP, Osborne JM, Nathke IS. 2016. Paneth cell-rich regions separated by a cluster of Lgr5+ cells initiate crypt fission in the intestinal stem cell niche. PLoS Biol 14:e1002491. [DOI] [PMC free article] [PubMed] [Google Scholar]
- Muncan V, Faro A, Haramis AP, Hurlstone AF, Wienholds E, van Es J, Korving J, Begthel H, Zivkovic D, Clevers H. 2007. T-cell factor 4 (Tcf7l2) maintains proliferative compartments in zebrafish intestine. EMBO Rep 8:966–973. [DOI] [PMC free article] [PubMed] [Google Scholar]
- Olden T, Akhtar T, Beckman SA, Wallace KN. 2008. Differentiation of the zebrafish enteric nervous system and intestinal smooth muscle. Genesis 46:484–498. [DOI] [PubMed] [Google Scholar]
- Rothenberg ME, Nusse Y, Kalisky T, Lee JJ, Dalerba P, Scheeren F, Lobo N, Kulkarni S, Sim S, Qian D, Beachy PA, Pasricha PJ, Quake SR, Clarke MF. 2012. Identification of a cKit(+) colonic crypt base secretory cell that supports Lgr5(+) stem cells in mice. Gastroenterology 142:1195–1205 e1196. [DOI] [PMC free article] [PubMed] [Google Scholar]
- Schmidt GH, Winton DJ, Ponder BA. 1988. Development of the pattern of cell renewal in the crypt-villus unit of chimaeric mouse small intestine. Development 103:785–790. [DOI] [PubMed] [Google Scholar]
- Shyer AE, Huycke TR, Lee C, Mahadevan L, Tabin CJ. 2015. Bending gradients: how the intestinal stem cell gets its home. Cell 161:569–580. [DOI] [PMC free article] [PubMed] [Google Scholar]
- Shyer AE, Tallinen T, Nerurkar NL, Wei Z, Gil ES, Kaplan DL, Tabin CJ, Mahadevan L. 2013. Villification: how the gut gets its villi. Science 342:212–218. [DOI] [PMC free article] [PubMed] [Google Scholar]
- Spence JR, Lauf R, Shroyer NF. 2011. Vertebrate intestinal endoderm development. Dev Dyn 240:501–520. [DOI] [PMC free article] [PubMed] [Google Scholar]
- Stange DE, Clevers H. 2013. Concise review: the yin and yang of intestinal (cancer) stem cells and their progenitors. Stem Cells 31:2287–2295. [DOI] [PubMed] [Google Scholar]
- Tan CW, Hirokawa Y, Gardiner BS, Smith DW, Burgess AW. 2013. Colon cryptogenesis: asymmetric budding. PLoS One 8:e78519. [DOI] [PMC free article] [PubMed] [Google Scholar]
- Wallace kN, Akhter S, Smith EM, Lorent K, Pack M. 2005. Intestinal growth and differentiation in zebrafish. Mech Dev 122:157–173. [DOI] [PubMed] [Google Scholar]
- Wallace KN, Pack M. 2003. Unique and conserved aspects of gut development in zebrafish. Dev Biol 255:12–29. [DOI] [PubMed] [Google Scholar]
- Westerfield M 1993. The zebrafish book: a guide for the laboratory use of zebrafish (Brachydanio rerio). Eugene, OR: M. Westerfield. 1 v. [Google Scholar]
- Yanai H, Atsumi N, Tanaka T, Nakamura N, Komai Y, Omachi T, Tanaka K, Ishigaki K, Saiga K, Ohsugi H, Tokuyama Y, Imahashi Y, Ohe S, Hisha H, Yoshida N, Kumano K, Kon M, Ueno H. 2017. Intestinal stem cells contribute to the maturation of the neonatal small intestine and colon independently of digestive activity. Sci Rep 7:9891. [DOI] [PMC free article] [PubMed] [Google Scholar]