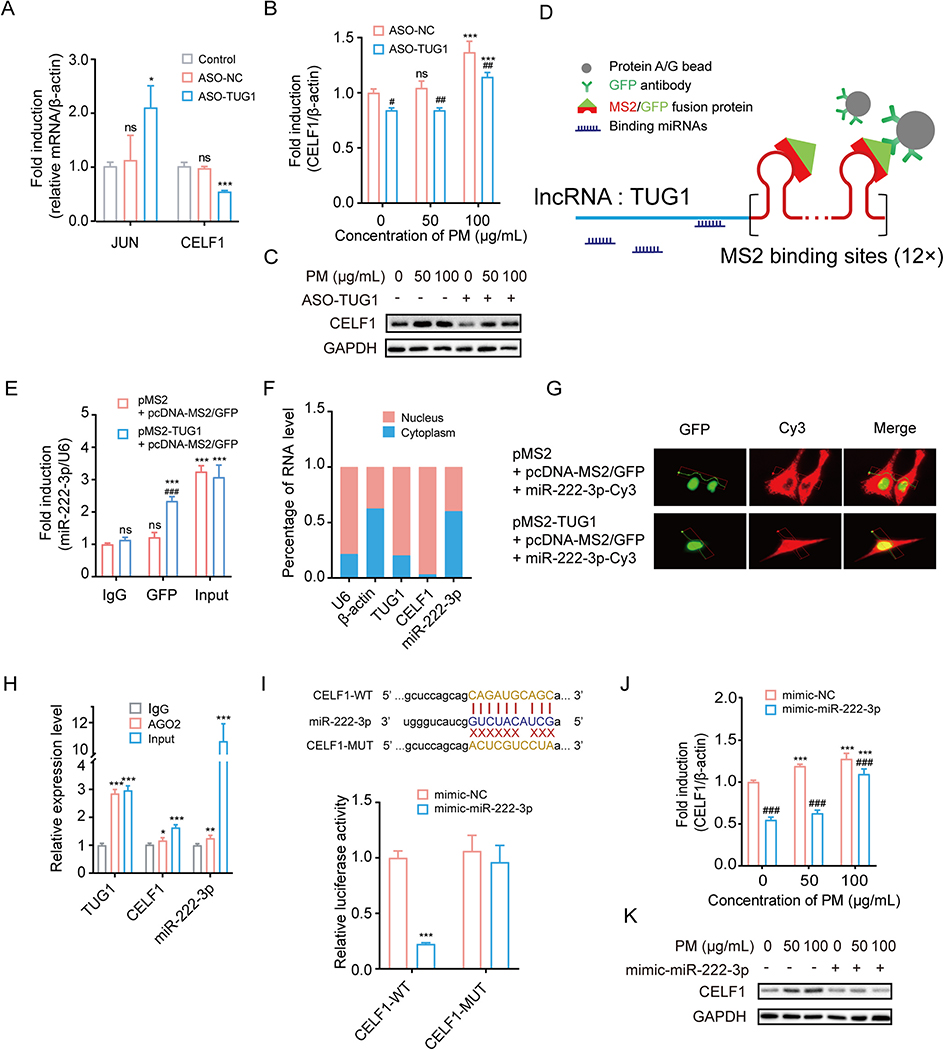
Fig. 2.
TUG1 regulates CELF1 by acting as a ceRNA sponge for miR-222–3p. (A) mRNA expression levels of JUN and CELF1 in HBE cells transfected with ASO-NC or ASO-TUG1. * P < 0.05, *** P < 0.001, compared with control. (B-C) mRNA and protein levels of CELF1 in HBE cells treated with ASO-TUG1 after exposed to PM (0, 50 or 100 μg/mL). *** P < 0.001, compared with control; # P < 0.05, ## P < 0.01, ### P < 0.001, compared with ASO-NC within each group. (D) Schematic diagram of MS2-GFP-RIP system. (E) miR-222–3p levels bound to GFP in HBE cells. *** P < 0.001, compared with IgG; ### P < 0.001, compared with control within each group. (F) Subcellular localization of TUG1, CELF1 and miR-222–3p in HBE cells. (G) Representative images of HBE cells with co-transfection of pMS2-TUG1, pcDNA-MS2/GFP and miR-222–3p-Cy3 or pMS2, pcDNA-MS2/GFP and miR-222–3p-Cy3. Green, GFP; Red, Cy3. (H) TUG1, CELF1 and miR-222–3p levels bound to AGO2 in HBE cells. * P < 0.05; ** P < 0.01; *** P < 0.001, compared with IgG. (I) The predicted binding sites of miR-222–3p on 3′ UTR of CELF1. Luciferase reporter assays validated the binding of miR-222–3p to CELF1. *** P < 0.001, compared with mimic-NC. (J-K) mRNA and protein levels of CELF1 in HBE cells treated with mimic-miR-222–3p after exposed to PM (0, 50 or 100 μg/mL). *** P < 0.001, compared with control; ### P < 0.001, compared with mimic-NC within each group.

