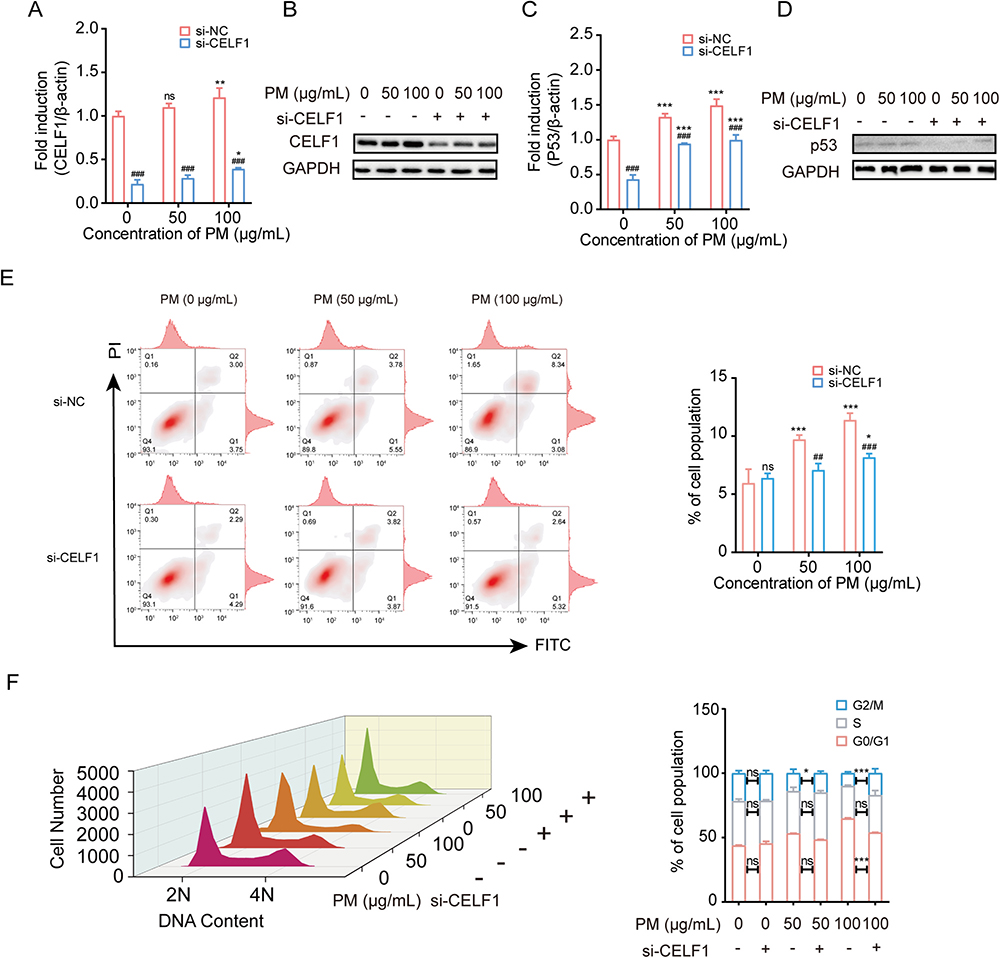
Fig. 3.
Knockdown CELF1 inhibited PM-induced apoptosis, cell cycle arrest, and activation of P53. (A-B) mRNA and protein levels of CELF1 in HBE cells treated with si-CELF1 after exposed to PM (0, 50 or 100 μg/mL). * P < 0.05, ** P < 0.01, compared with control; ### P < 0.001, compared with si-NC within each group. (C-D) mRNA and protein levels of JUN in HBE cells treated with si-CELF1 after exposed to PM (0, 50 or 100 μg/mL). *** P < 0.001, compared with control; ### P < 0.001, compared with si-NC within each group. (E) Flow cytometric analysis of apoptosis in HBE cells treated with si-CELF1 after exposure to PM (0, 50 or 100 μg/mL). * P < 0.05, *** P < 0.001, compared with control; ## P < 0.01, ### P < 0.001, compared with si-NC within each group. (F) Flow cytometric analysis of cell cycle in HBE cells treated with si-CELF1 after exposure to PM (0, 50 or 100 μg/mL). * P < 0.05, ** P < 0.01, *** P < 0.001, compared with si-NC. The cell cycle is divided into distinct consecutive phases defined as quiescent state and first gap phase (G0/G1), DNA synthesis phase (S), second gap phase and mitosis phase (G2/M). 2 N represents G0/G1 and 4 N represents G2/M while 2–4 N represents S.

