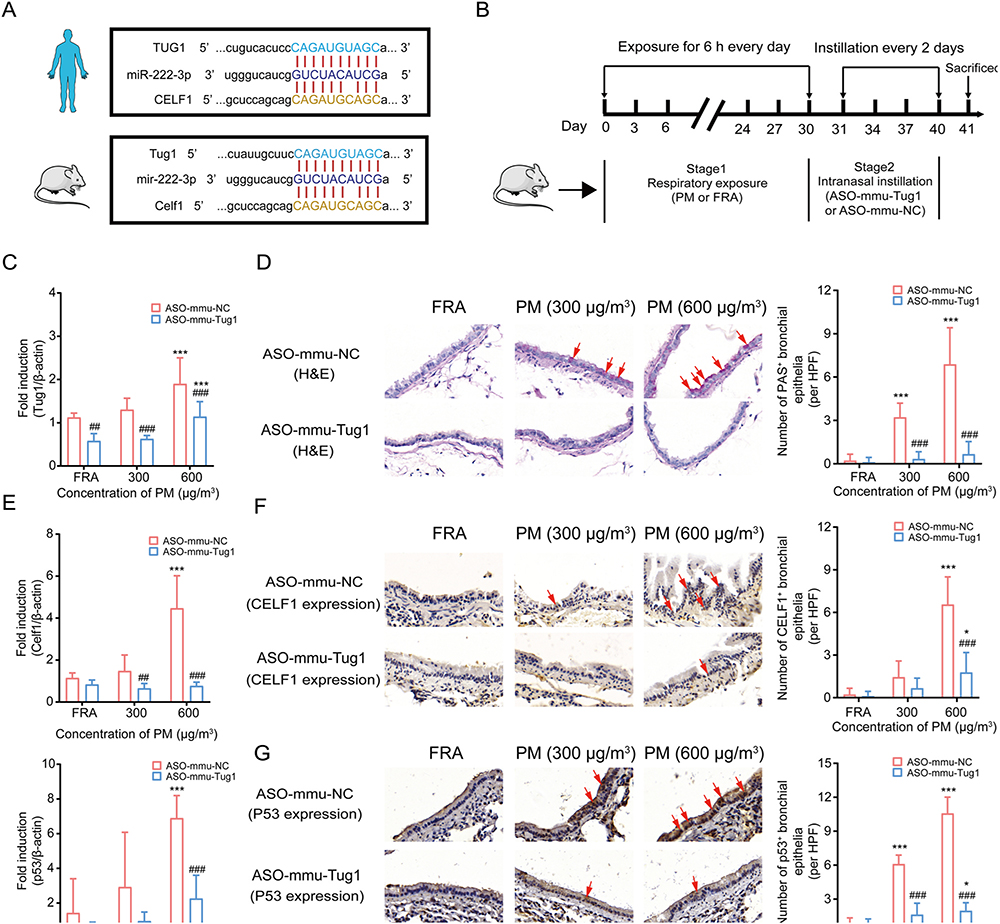
Fig. 5.
Downregulation of Tug1 rescued PM exposure-induced AHR in mice through the Tug1/Celf1/p53 regulatory axis. (A) Homology diagram of RNAs in the binding sites of ceRNA network between human and mouse. (B) Workflow of murine model treated with ASO-mmu-NC or ASO-mmu-Tug1 after expose to PM (0, 300 or 600 μg/m3). (C) Expression levels of Tug1 in murine lung tissues followed by PM (0, 300 or 600 μg/m3) with ASO-Tug1 treatment. *** P < 0.001, compared with control; ## P < 0.01, ### P < 0.001, compared with ASO-mmu-NC within each group. (n = 5 /group). (D) Representative images of AHR and the number of PAS+ bronchial epithelia per HPF in mice bronchial airway followed by PM (0, 300 or 600 μg/m3) with ASO-mmu-Tug1 treatment. *** P < 0.001, compared with control; ### P < 0.001, compared with ASO-mmu-NC within each group. n = 9/group (3 HPF/section × 1 section/mouse × 3 mice/group); HPF: high-power field at 400 × magnification, scale bar = 50 μm. (E) mRNA expression levels of Celf1 and p53 in murine lung tissues exposed to PM (0, 300 or 600 μg/m3) with ASO-mmu-Tug1 treatment. *** P < 0.001, compared with control; ## P < 0.01, ### P < 0.001, compared with ASO-mmu-NC within each group. (n = 5 /group), (F-G) Expression levels of CELF1 and p53 protein in mice bronchial airway exposed to PM (0, 300 or 600 μg/m3) with ASO-mmu-Tug1 treatment. * P < 0.05, *** P < 0.001, compared with control; # P < 0.05, ### P < 0.001, compared with ASO-mmu-NC within each group. n = 9/group (3 HPF/section × 1 section/mouse × 3 mice/group); HPF: high-power field at 400 × magnification, scale bar = 50 μm.

