
Extended Data Fig. 5. Genes with signals of positive selection in Sherlock-Lung.
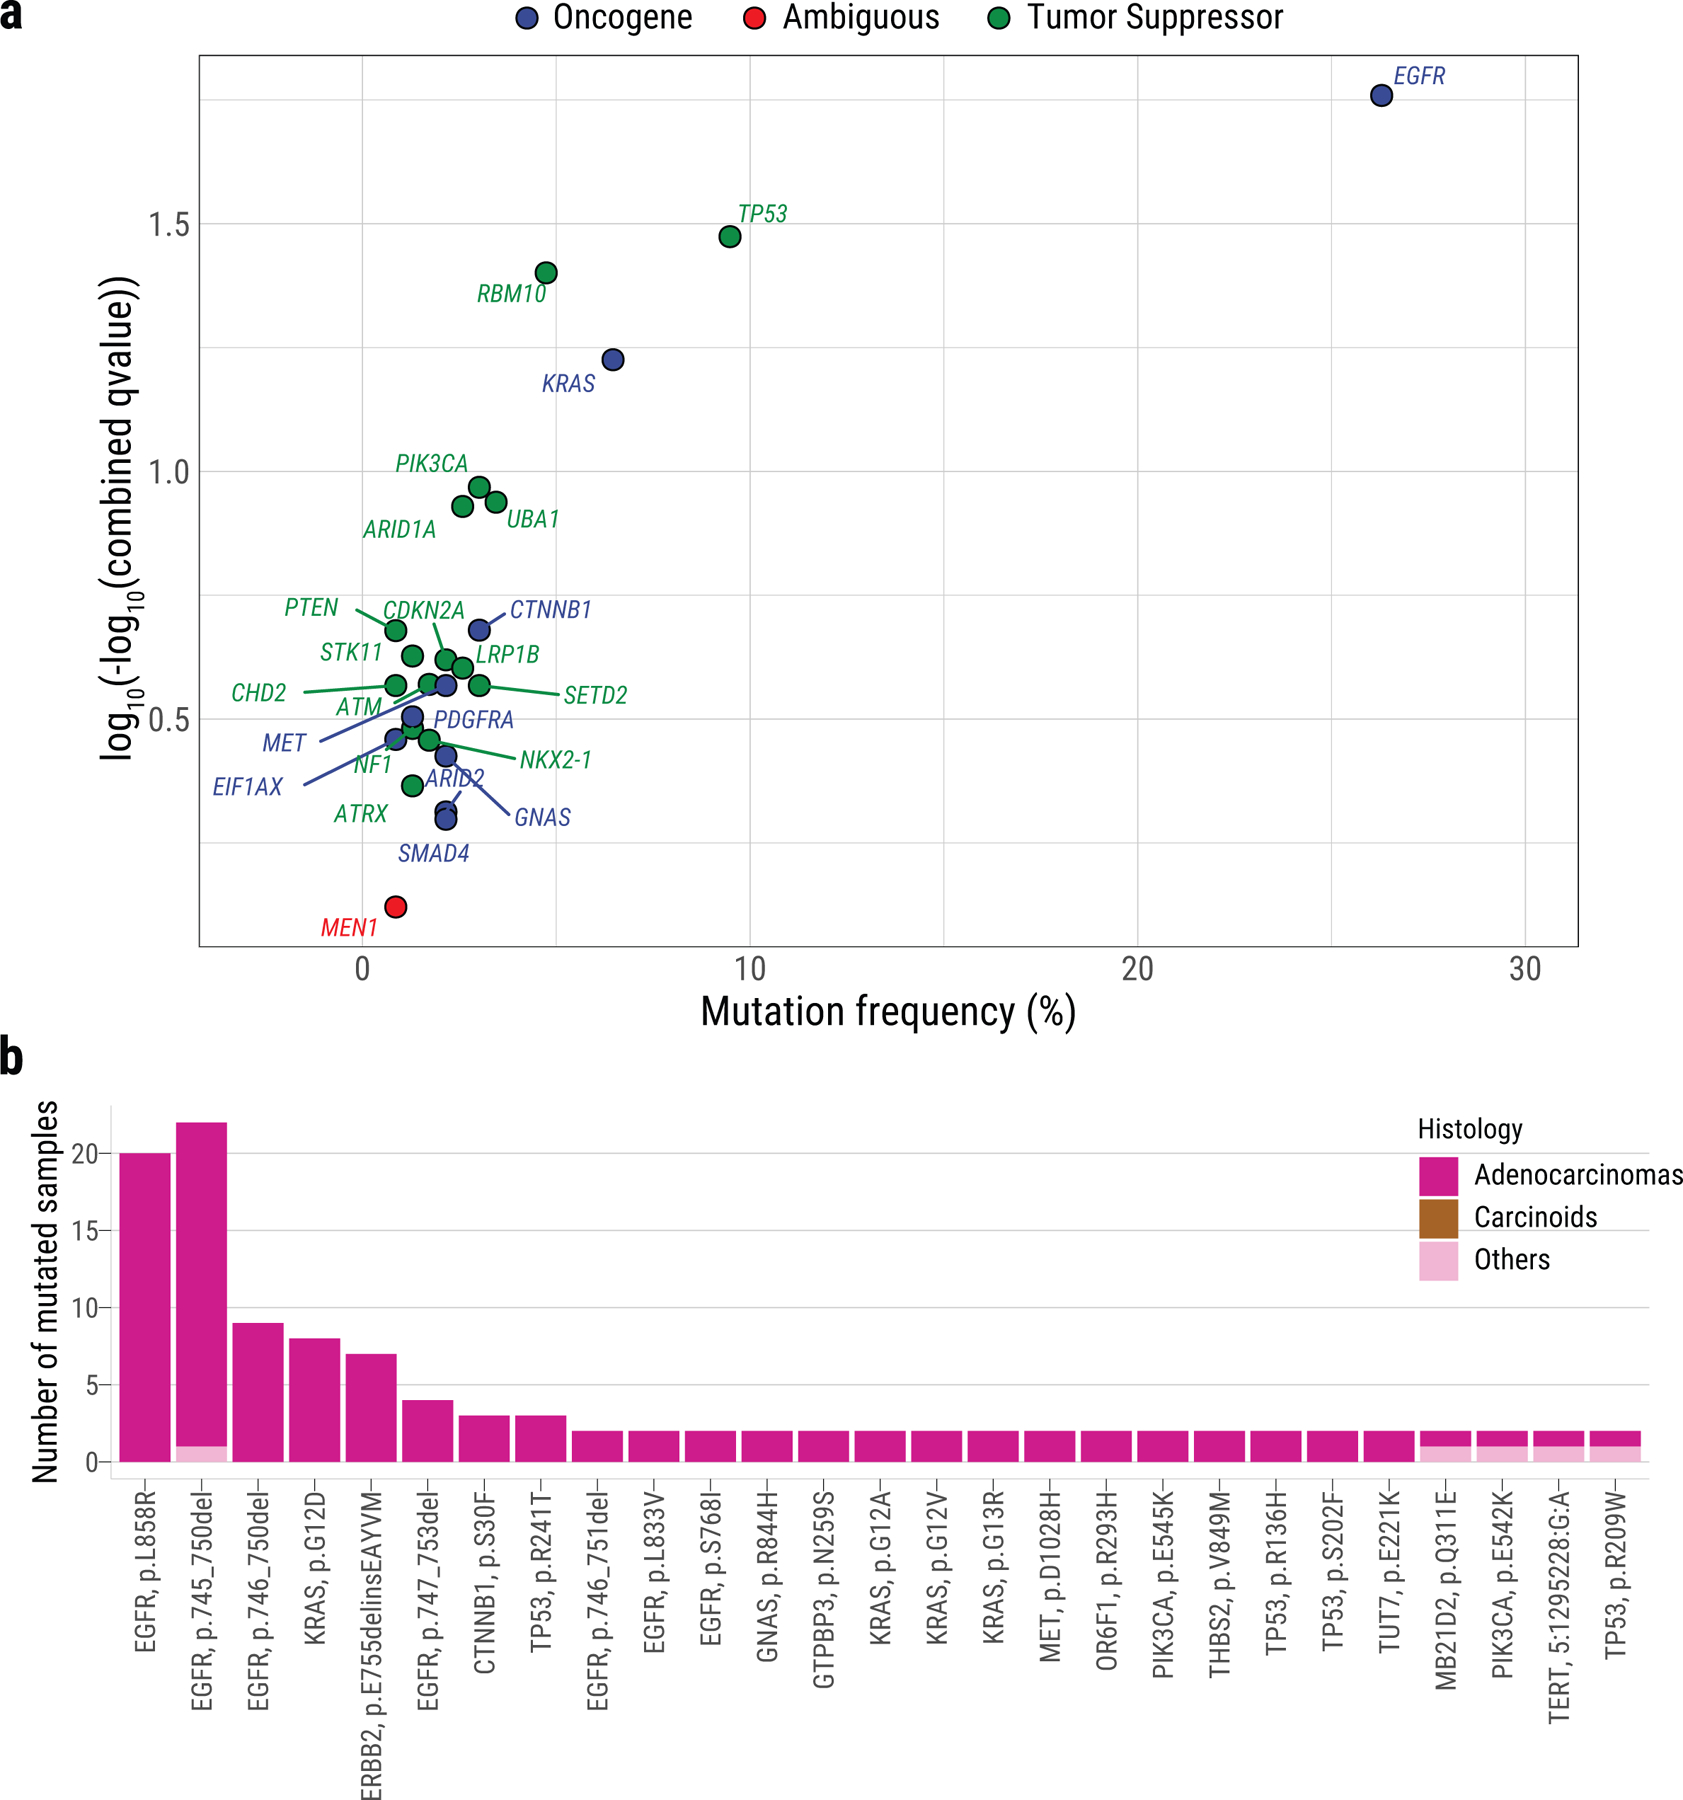
a, The scatter plot showing significantly mutated genes according to IntOGen q-value <0.05 (y-axis) and mutational frequency in the cohort (x-axis). Genes are colored according to their inferred mode of action in tumorigenesis. b, Recurrent non-synonymous driver mutations (in ≥2 patients).