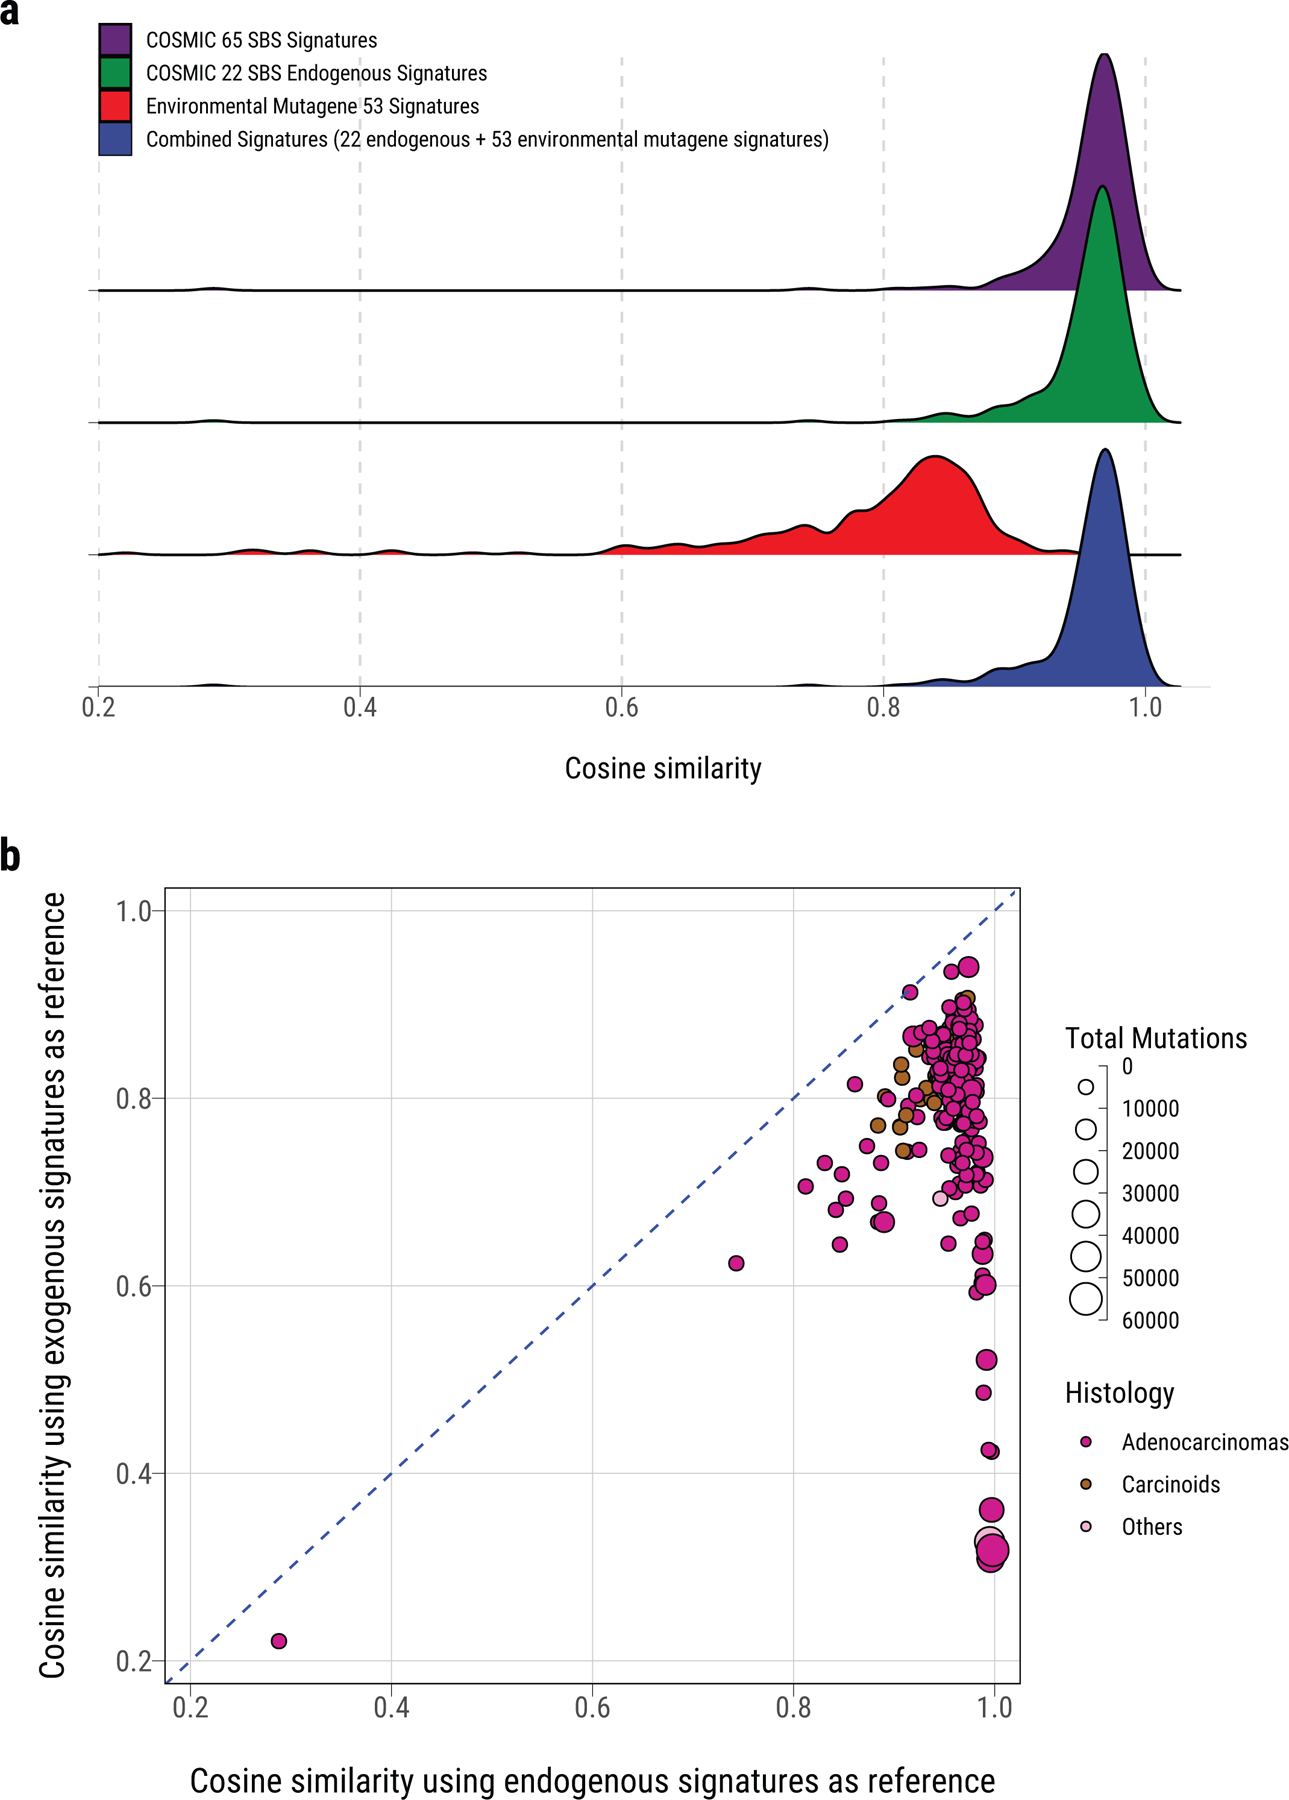
Extended Data Fig. 6. Dominant endogenous processes in Sherlock-Lung.

a, Density plot of cosine similarity between original mutational profile and reconstructed mutational profile using reference signatures from (top to bottom): 65 COSMIC SBS signatures, 22 COSMIC SBS signatures for endogenous processes, 53 MutaGene SBS signatures of environmental exposures, and a combined set of signatures including the 22 endogenous and 53 environmental exposure signatures. b, Comparison of the cosine similarity between the original mutational profiles and reconstructed mutational profiles using endogenous and exogenous signatures (similar to a). Each dot represents one sample. The size and color represent the total number of mutations and tumor histological type, respectively.
