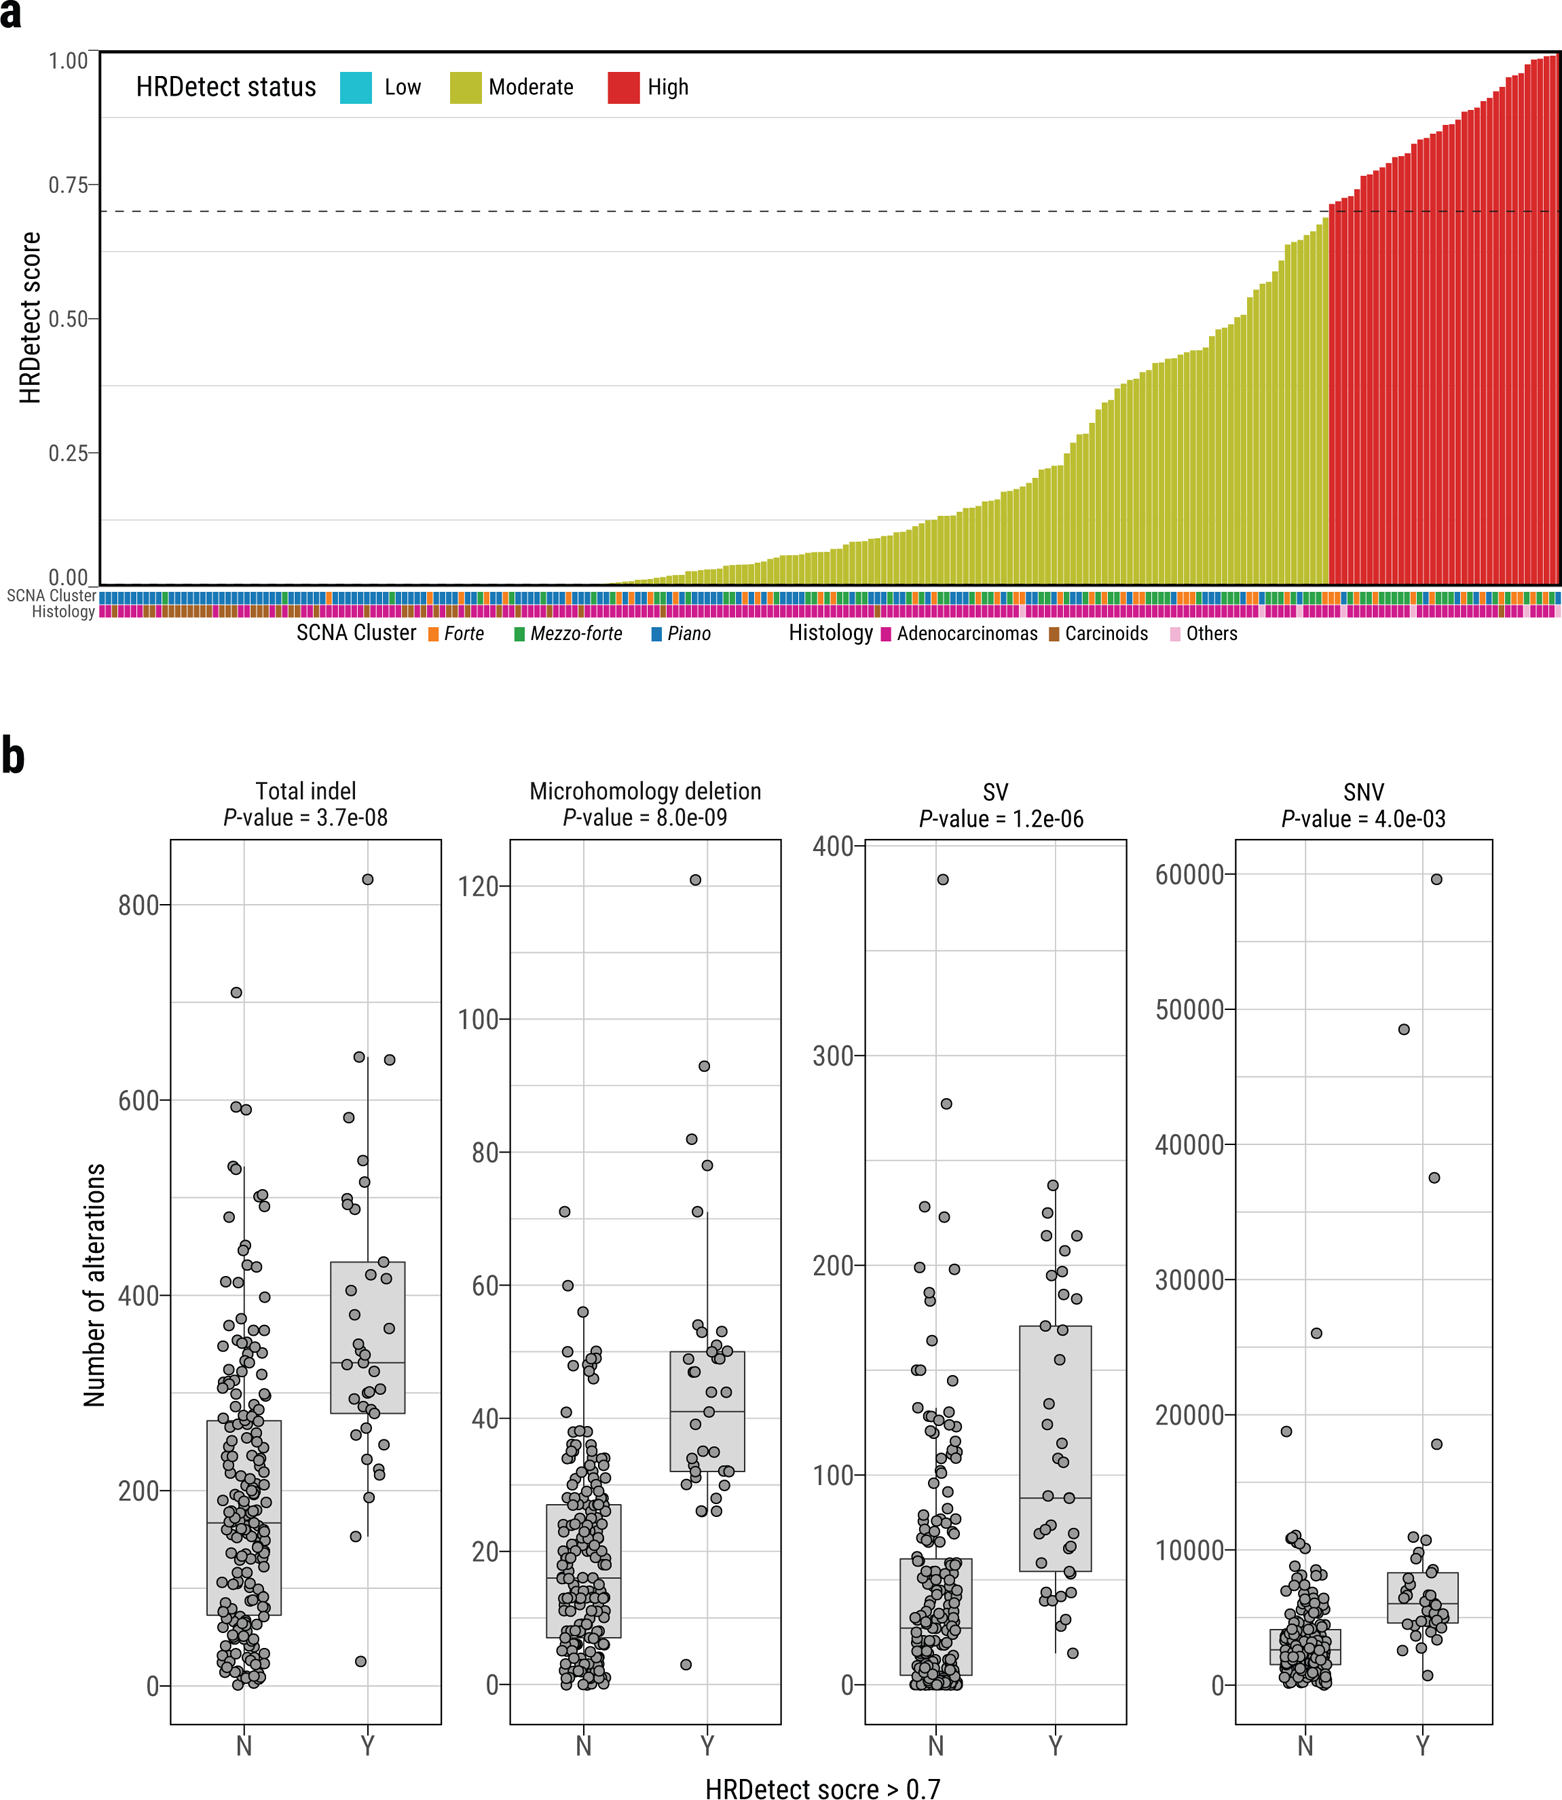
Extended Data Fig. 8. Homologous recombination deficiency (HRD) in Sherlock-Lung.

a, HRDetect scores of Sherlock-Lung samples. HRD-high: >0.7, HRD-low: < 0.005. b, Comparison of the number of total indels, microhomology deletions, SVs, and SNVs between samples with HRDetect score below 0.7 (group N) and above 0.7 (group Y). P-values are calculated using the two-sided Mann-Whitney U test. For box plots, center lines show the medians; box limits indicate the 25th and 75th percentiles; whiskers extend 1.5 times the interquartile range from the 25th and 75th percentiles.
