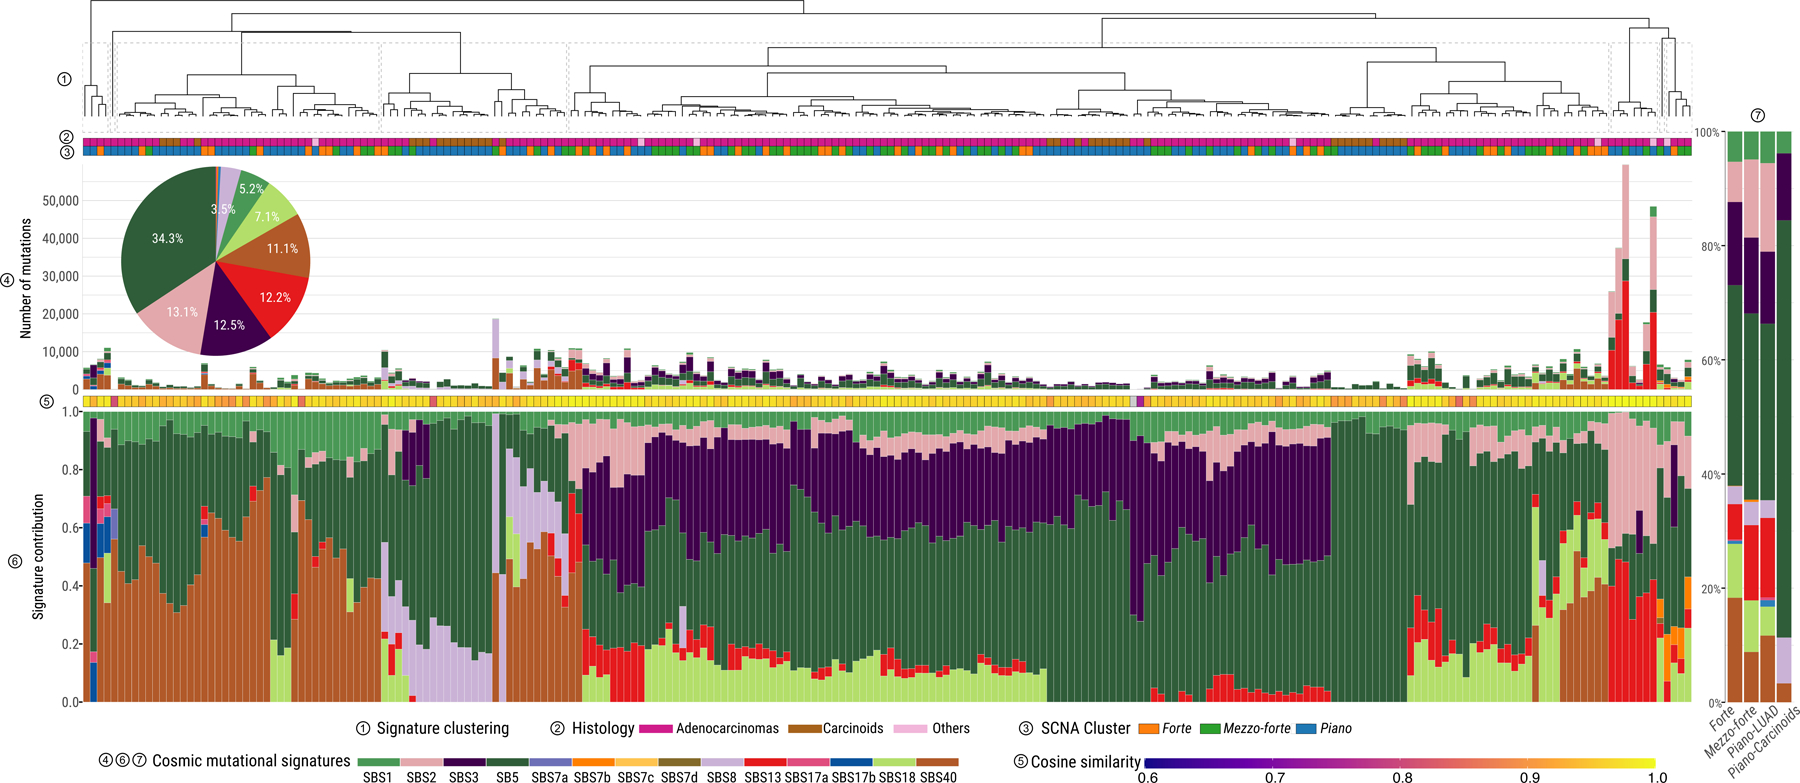
Fig. 4. Landscape of mutational processes in Sherlock-Lung.

Mutational signature profile of single base substitutions (SBS) across 232 Sherlock-Lung samples. Panels from top to bottom: 1) Unsupervised clustering based on the proportion of SBS signatures; 2) Tumor histological type; 3) SCNA cluster; 4) Pie chart showing the percentage of mutations contributed to each SBS signature and the barplot presenting the total number of SNVs assigned to each SBS signature; 5) Cosine similarity between original mutational profile and signature decomposition result; 6) Proportions of SBS mutational signatures in each sample. 7) Proportions of SBS mutational signatures in each SCNA subtype.
