
Fig. 6. Diagram of estimated ordering of significant SCNAs (including chromosome gains/losses and mutations) relative to WGD in three lung cancer subtypes based on SCNA clusters forte, mezzo-forte and piano.
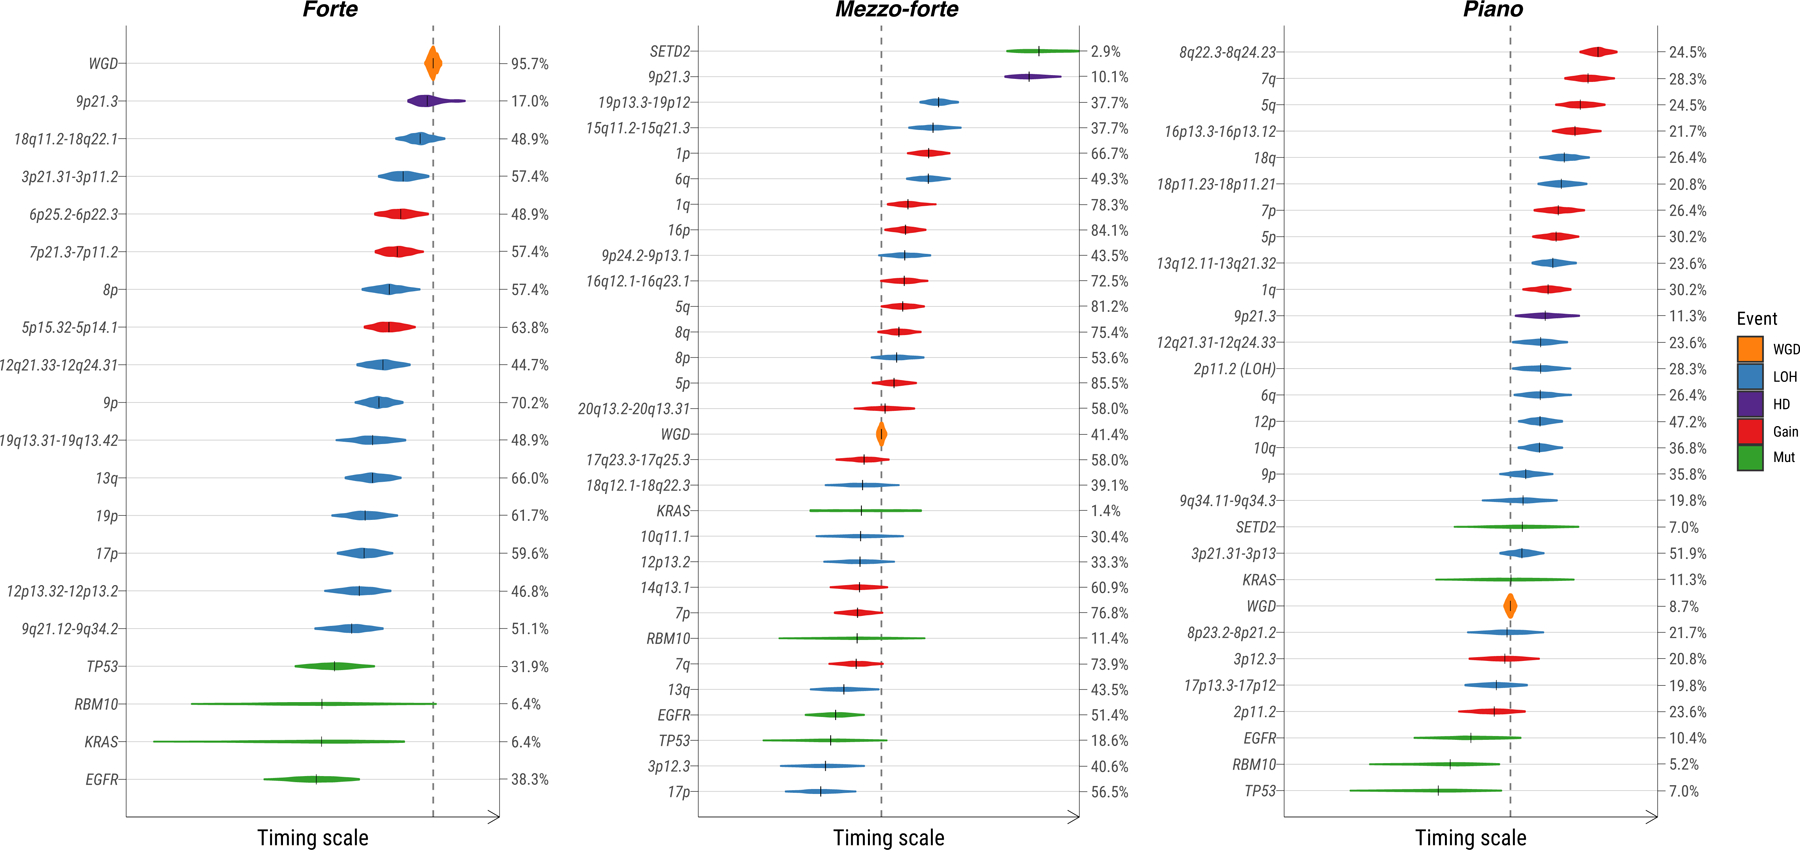
The size of violin plots denotes the uncertainty of timing for specific events across all samples and the short black solid lines represent the median time. The vertical dashed line indicates the median time for WGD events. Ordering of genomic events was based on the PlacketLuce package model with 95% CI. The frequency of each event is labeled on the right y-axis.